
January 2026 Santa Clara County Real Estate Market Update
Market Update David Kim January 26, 2026
Market Update David Kim January 26, 2026
A Market Regaining Its MomentumIn 2025, Bay Area real estate markets started the year with strong buyer demand but had much of the wind taken out of their sails by the political/economic uncertainty that soared in early spring. Then, in mid-late summer, stock markets rebounded to hit new highs, and interest rates began a sustained decline, initiating a shift in the psychology of buyers and sellers that is still developing. Still, national consumer confidence readings showed a significant split between the outlooks of more and less affluent households, and that affected market segments in different ways. Generally speaking, more expensive markets, powered by rising demand from affluent buyers seeing substantial increases in household wealth from stock market gains, performed better than more affordable markets, which tended to be more impacted by concerns regarding inflation, affordability and employment. Of course, Santa Clara County has some of the most affluent cities in the U.S. As 2026 begins, interest rates are near multi-year lows and stock markets are at or close to all-time peaks. Early in the new year, it is common for buyers, re-energized to move forward with major life decisions, to jump back into the market faster than sellers list their homes for sale. This disparity of increasing demand versus a low supply of new listings usually runs through the spring, typically making these months the most heated selling season of the year. Last year, this was weakened by the tariff shock. Barring new, unexpected economic alarms, we expect this spring to be stronger.
|
|
Stock market gains and falling mortgage rates improved buyer confidence and purchasing power in 2025-26.
|
|
Over multiple decades, Santa Clara County home values show strong long-term appreciation despite periodic cycles.
|
|
The following charts show varying price trends for single-family homes, townhomes, and condos.
|
|
Sales activity reflects a supply-constrained market, with limited listings shaping overall transaction volume.
|
|
Sales are increasingly concentrated in higher price tiers, highlighting the county's affluent buyer base.
|
|
Homes continue to sell quickly and often above asking, signaling persistent buyer competition.
|
|
Questions? Reach out to us at (650) 988-5114. |
Market Update


Market Update
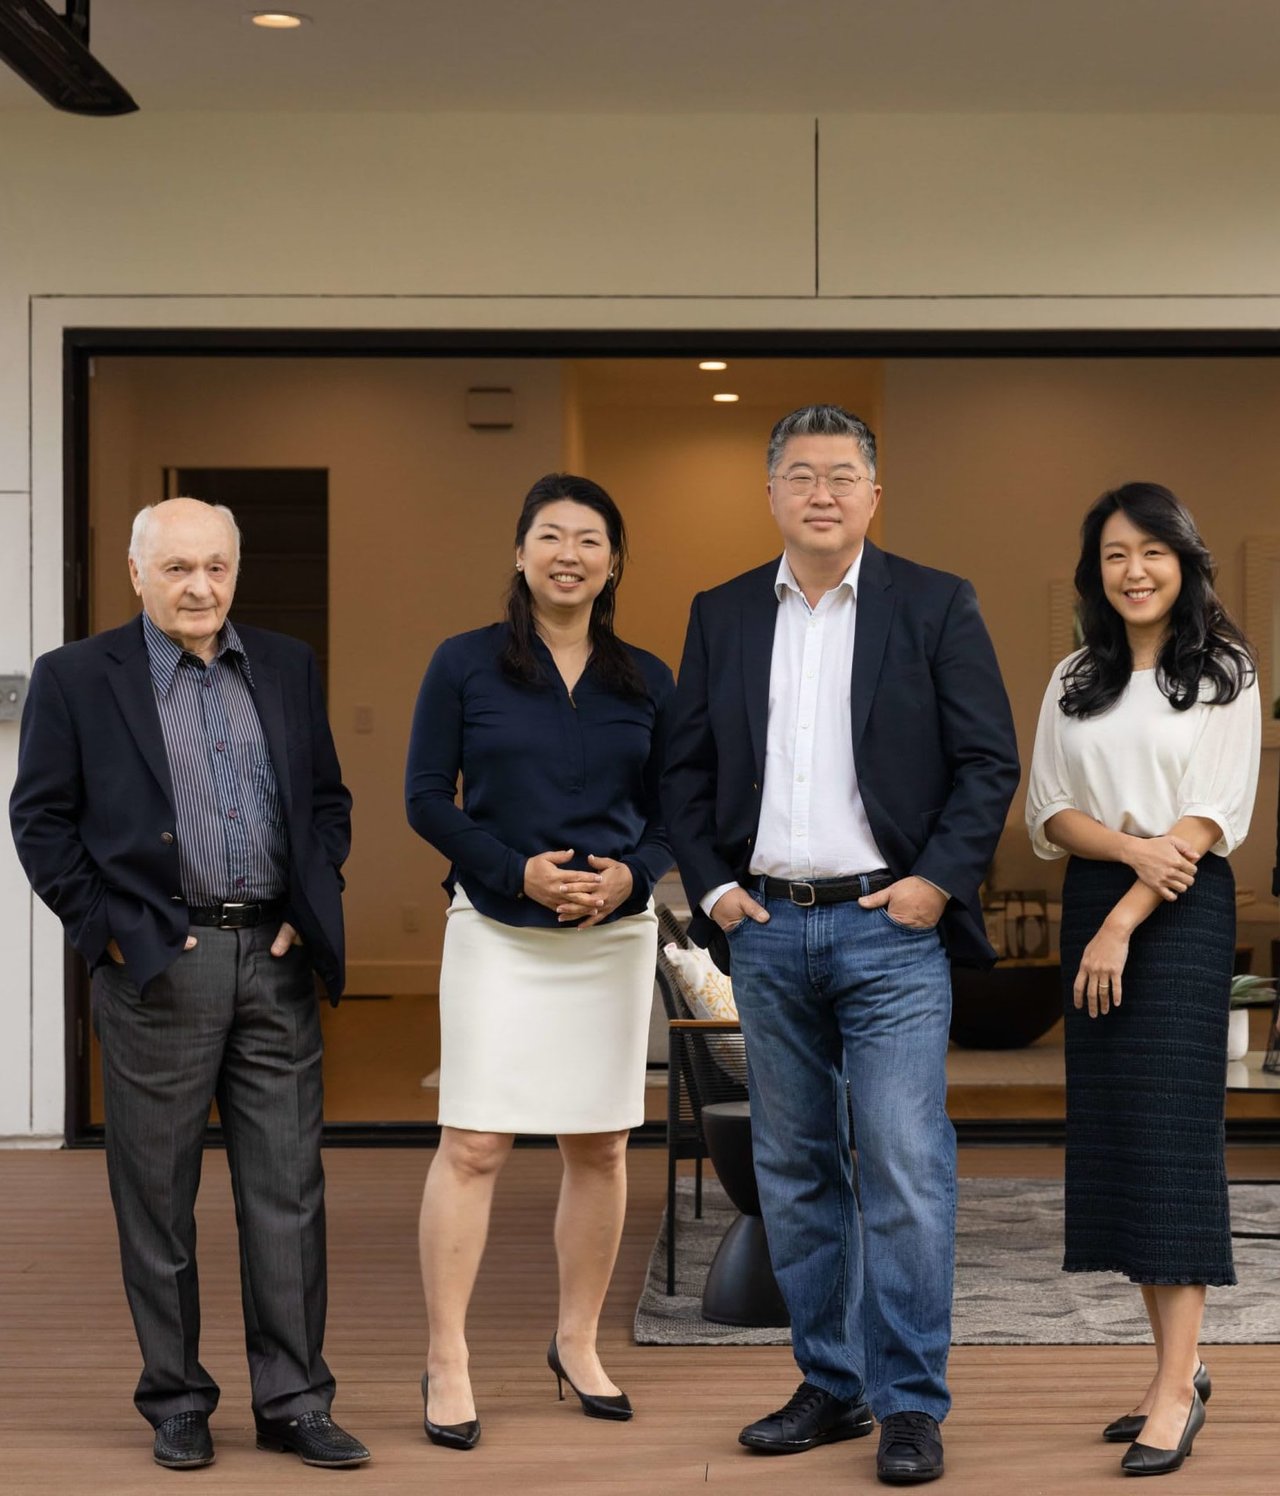
Partner with our dynamic team to unlock the full potential of your real estate endeavors in Silicon Valley. With our tailored approach and in-depth market knowledge, we'll ensure a seamless and extraordinary client experience.
Connect With Our Team to Learn More
19900 Stevens Creek Blvd, #100 Cupertino, CA 95014 David Kim | CA DRE# 01527235 Keller Williams Thrive | CA DRE# 02177478


