March 2026 Market Update
Market Update David Kim March 25, 2026
Market Update David Kim March 25, 2026
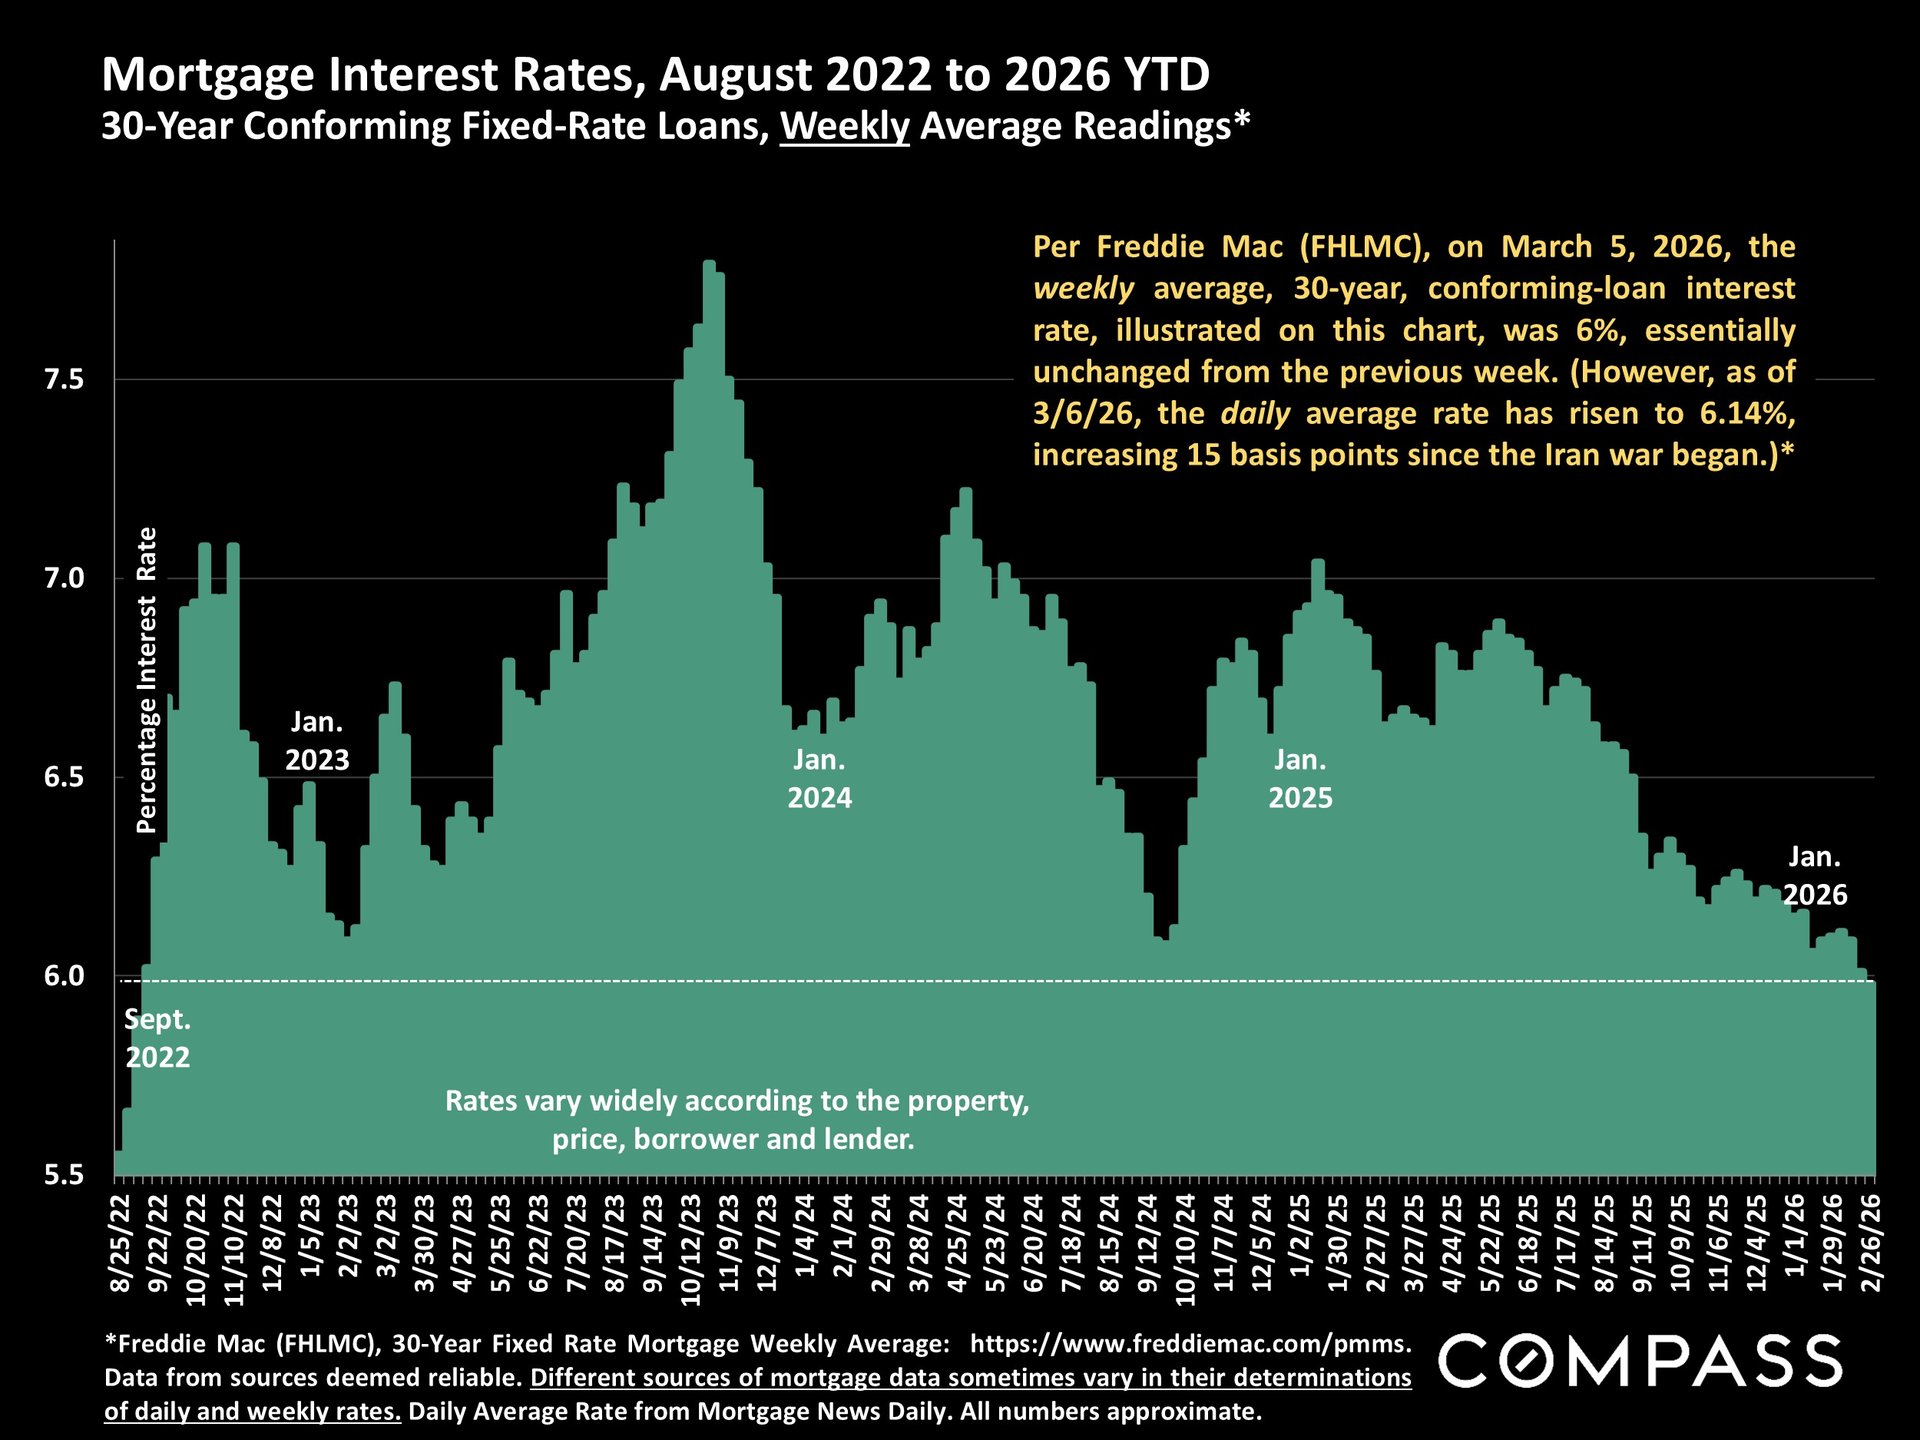
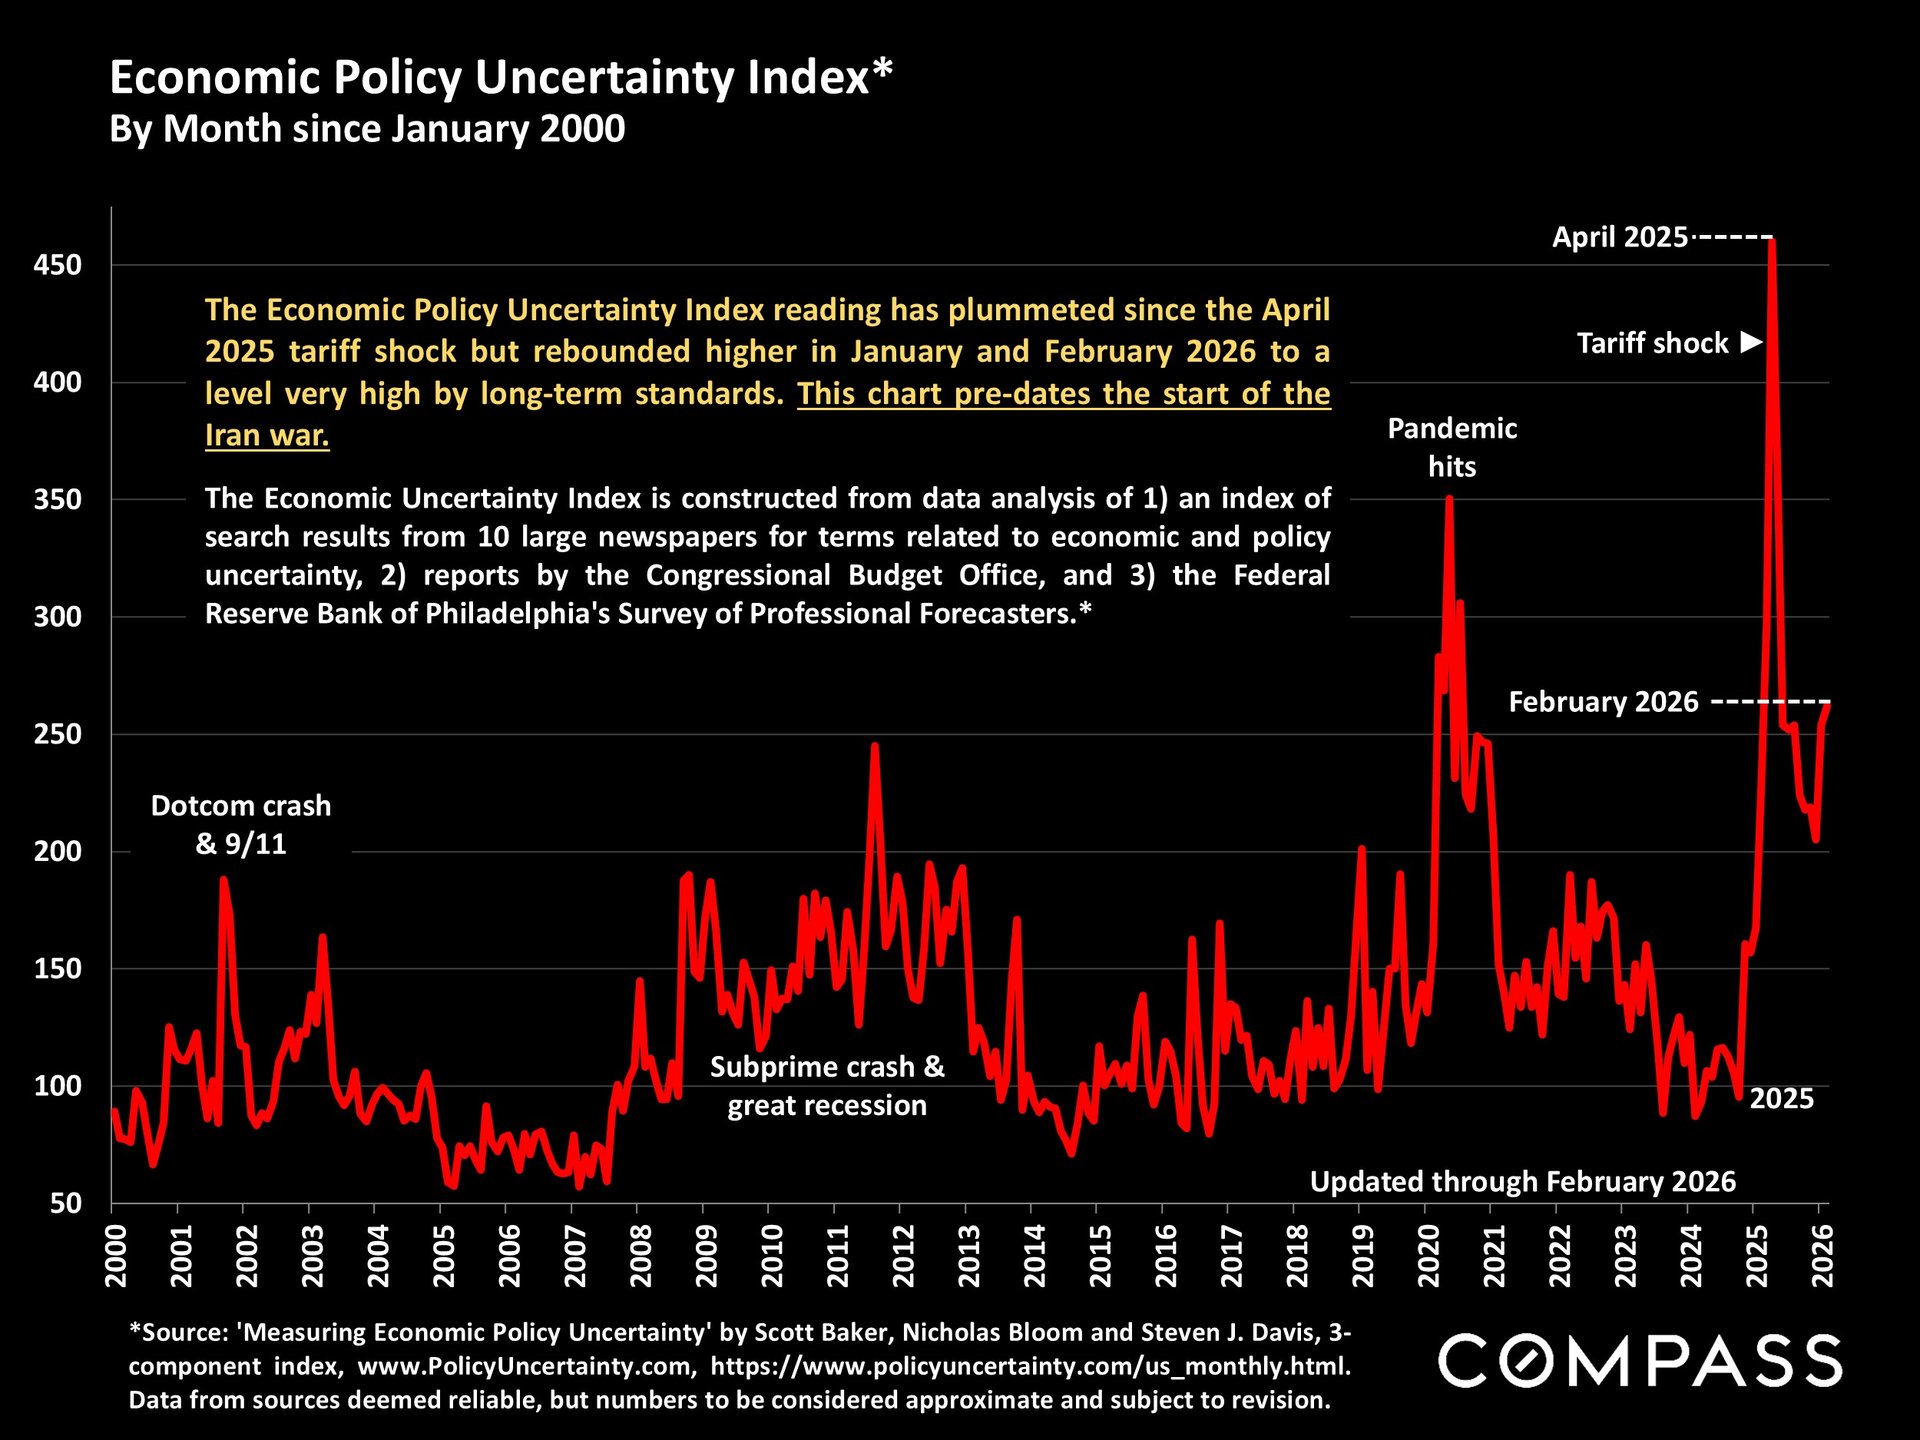
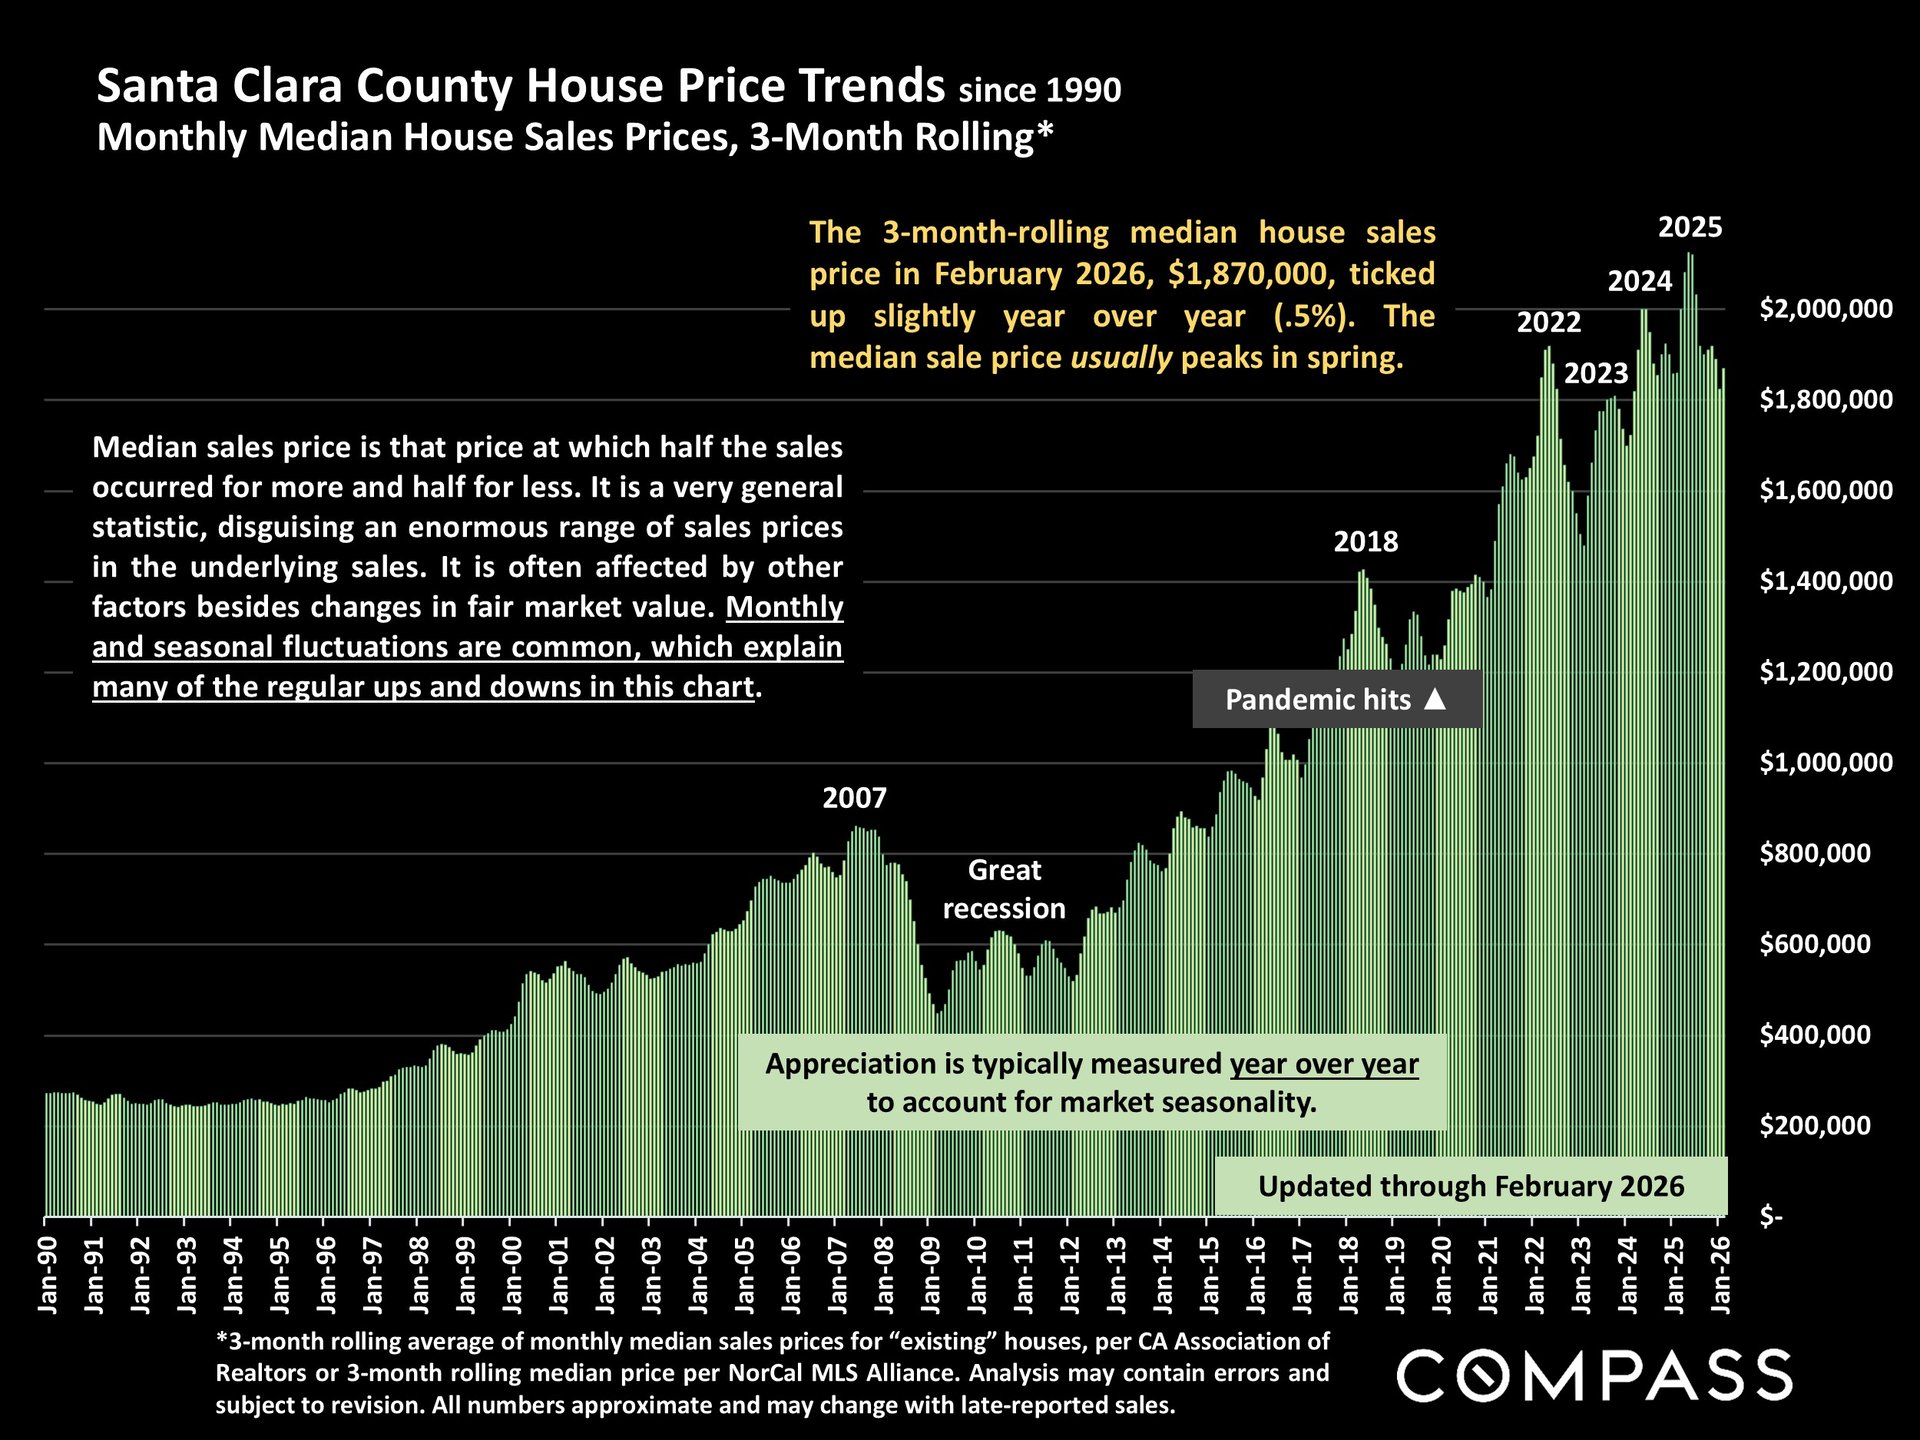
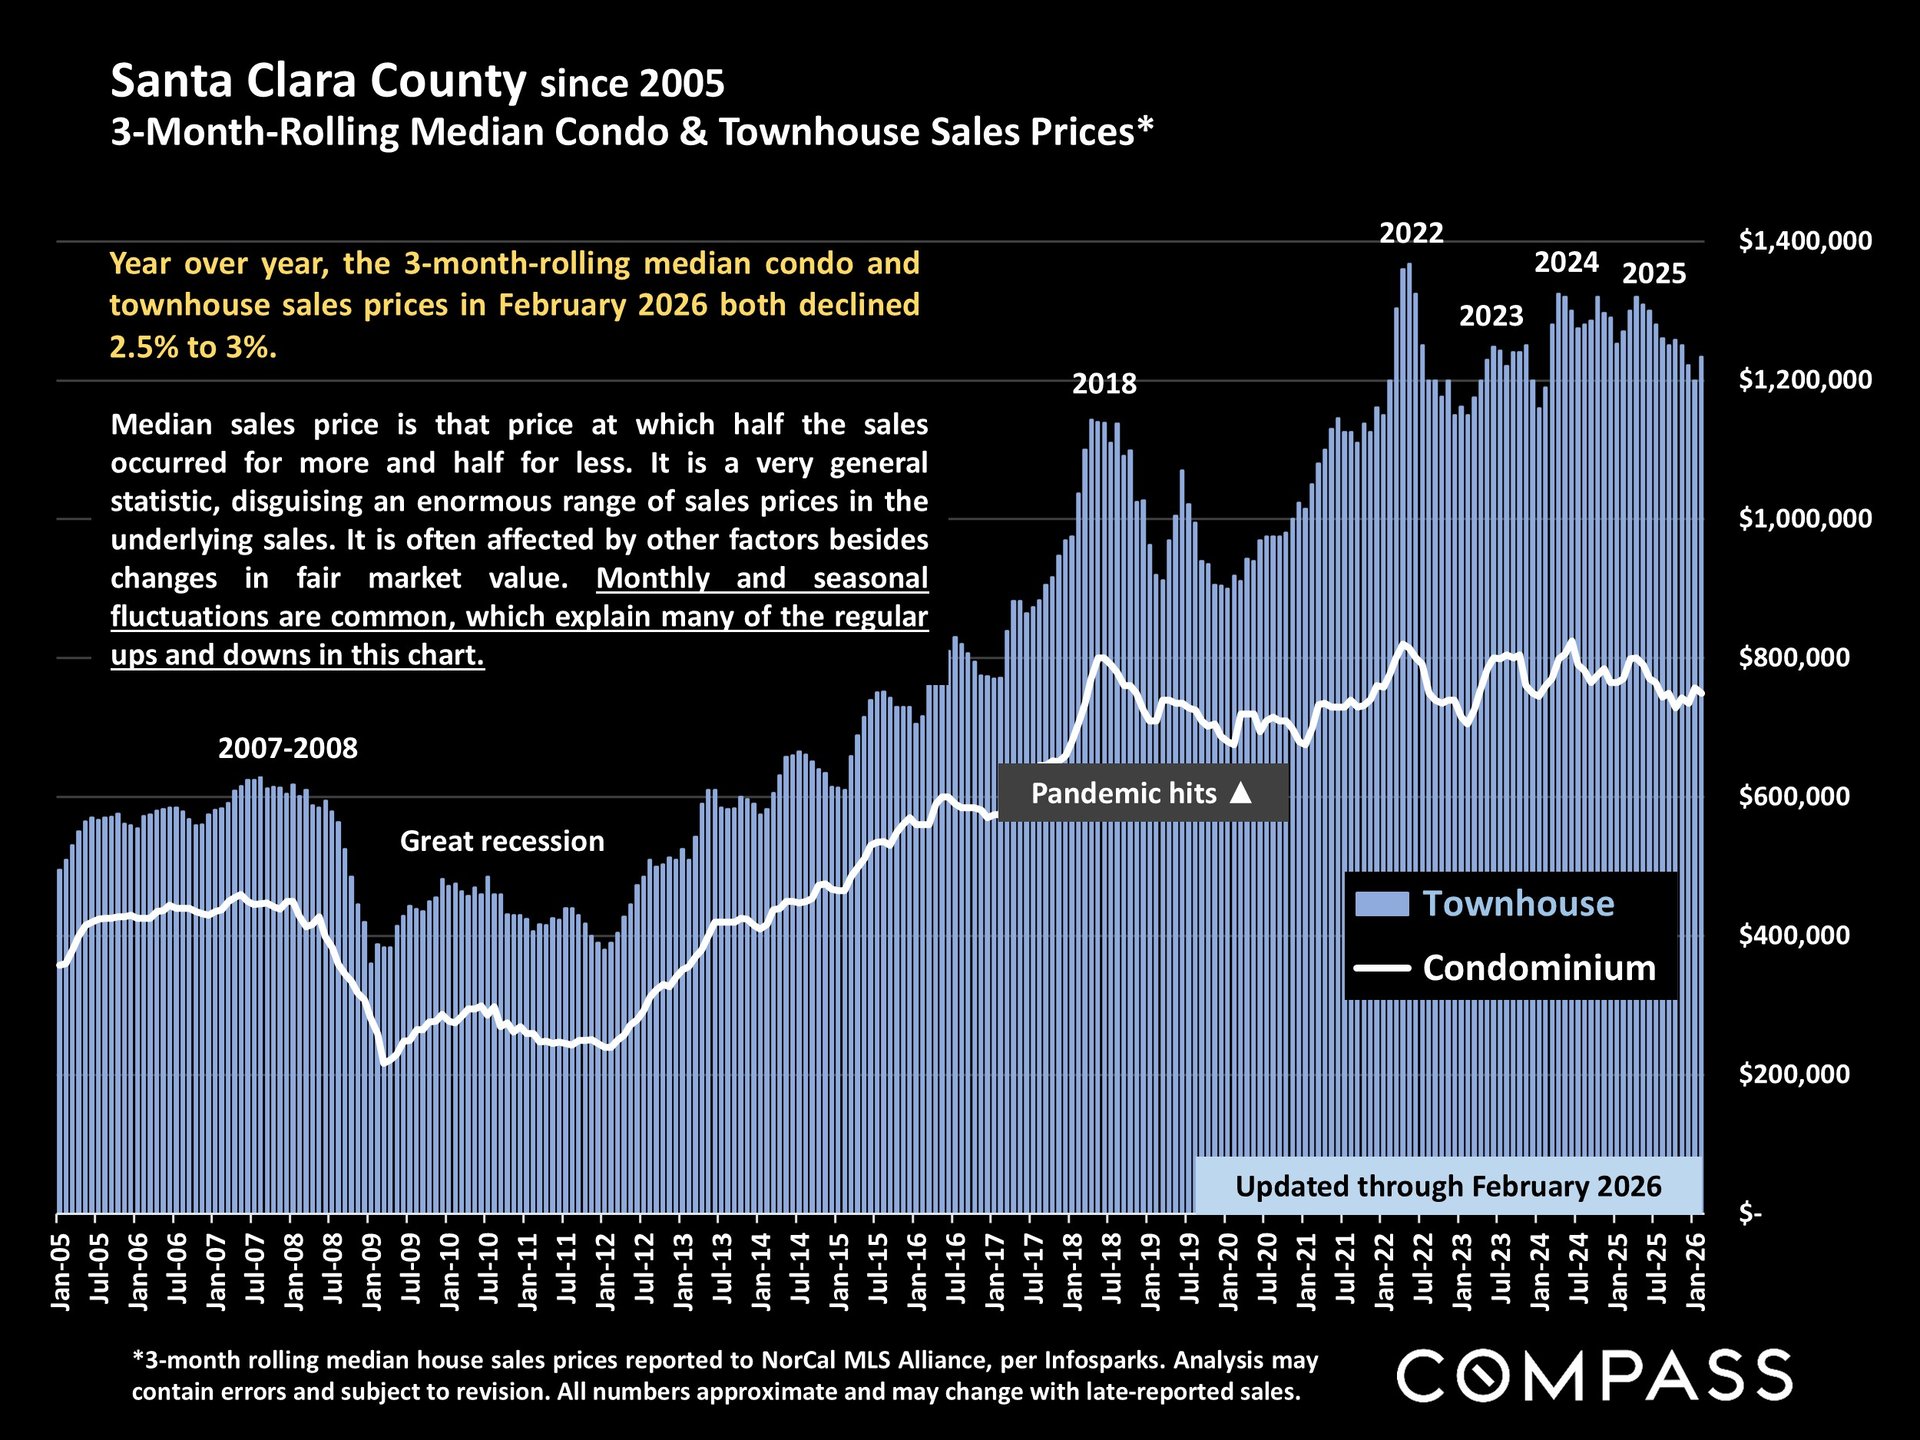
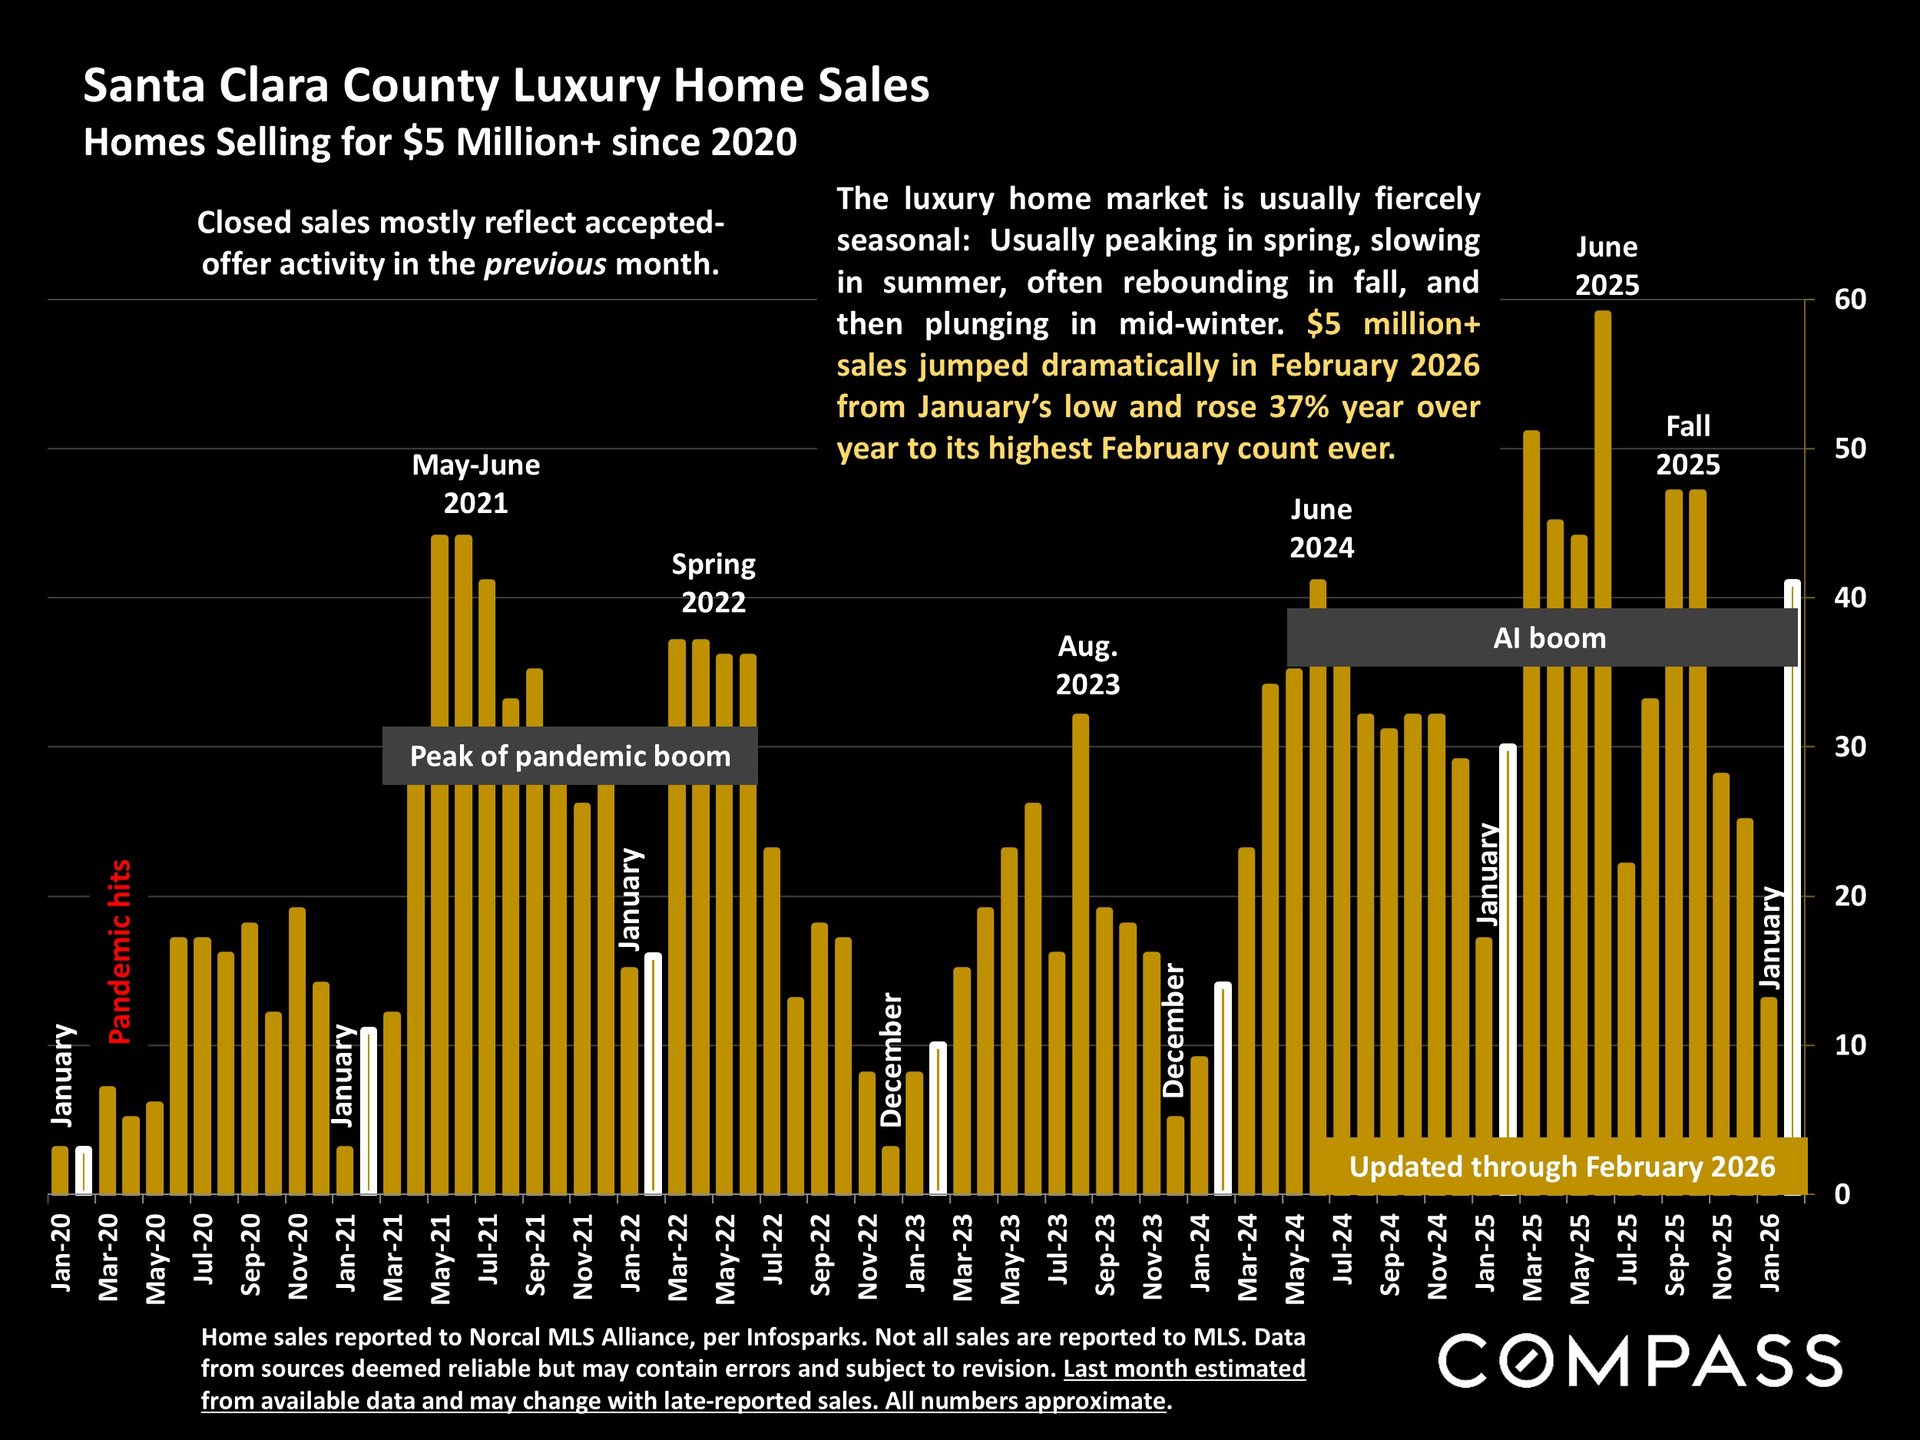
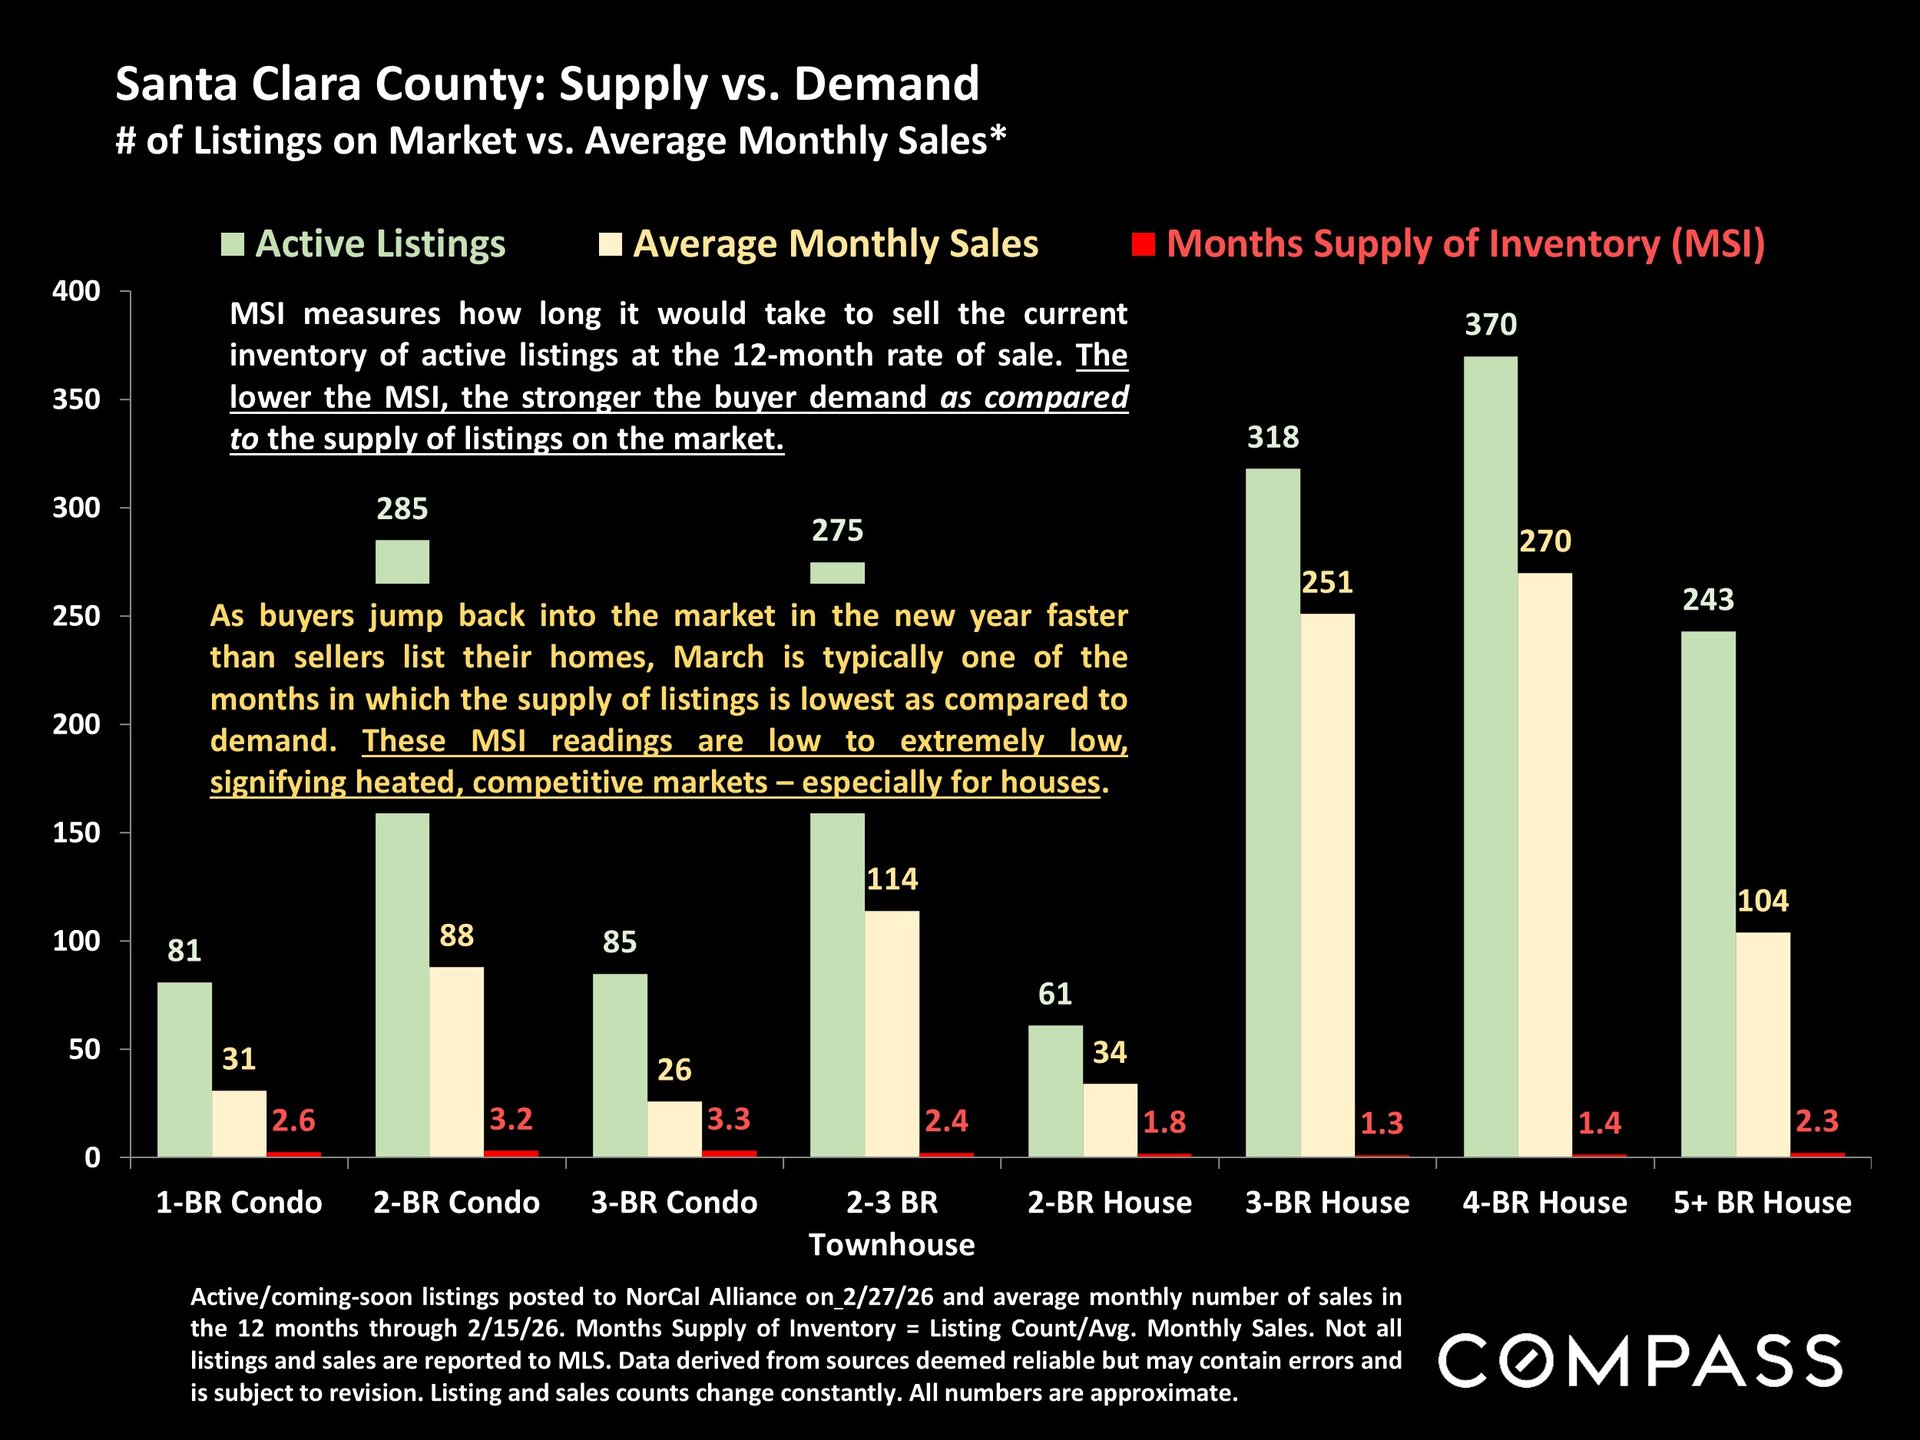
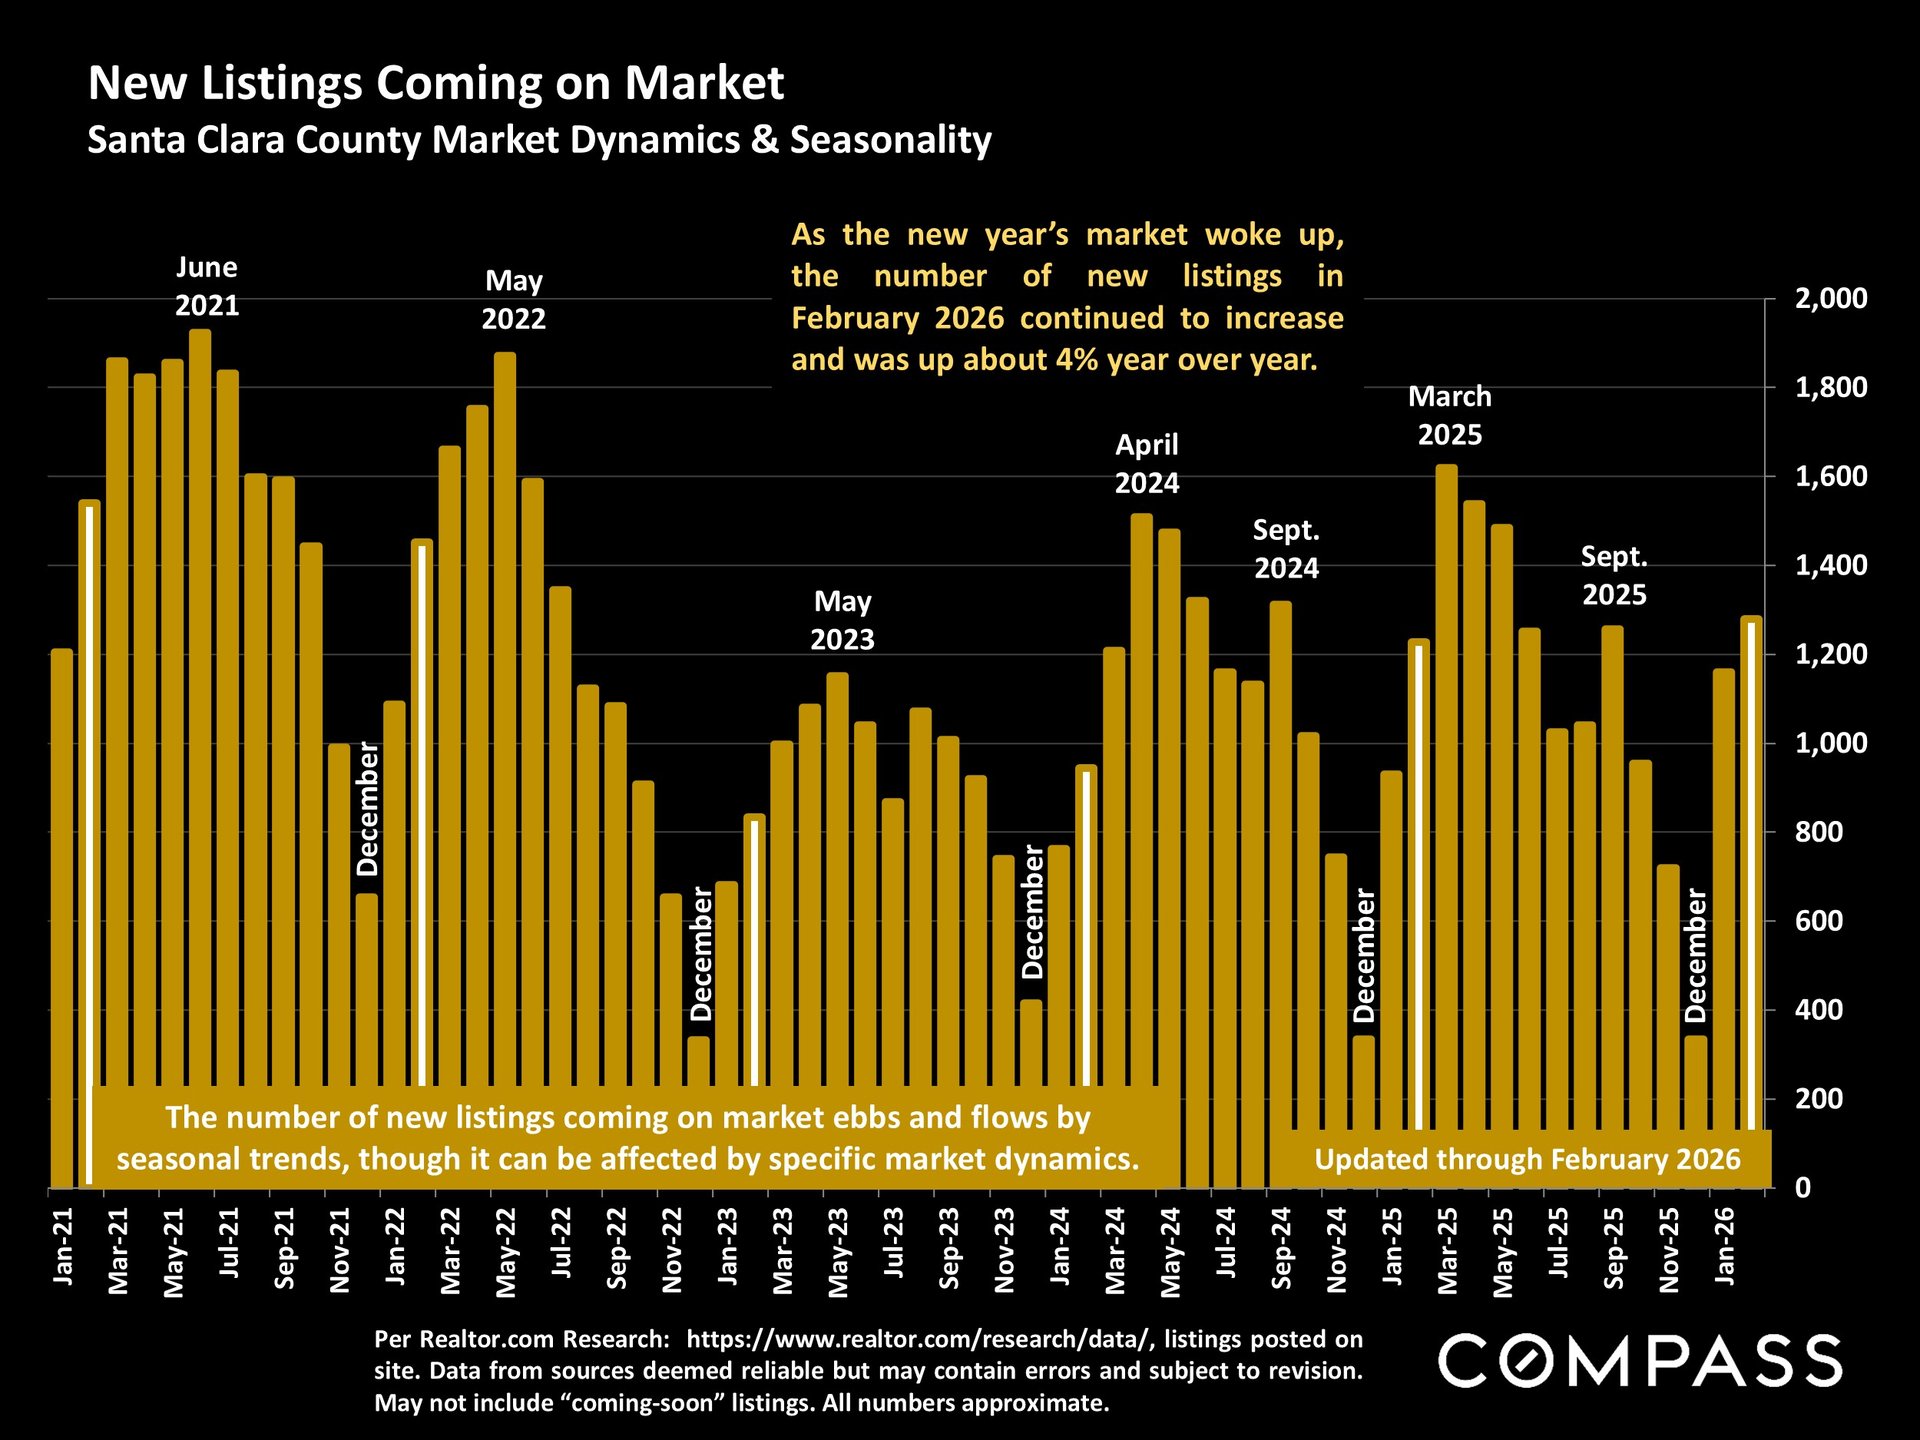
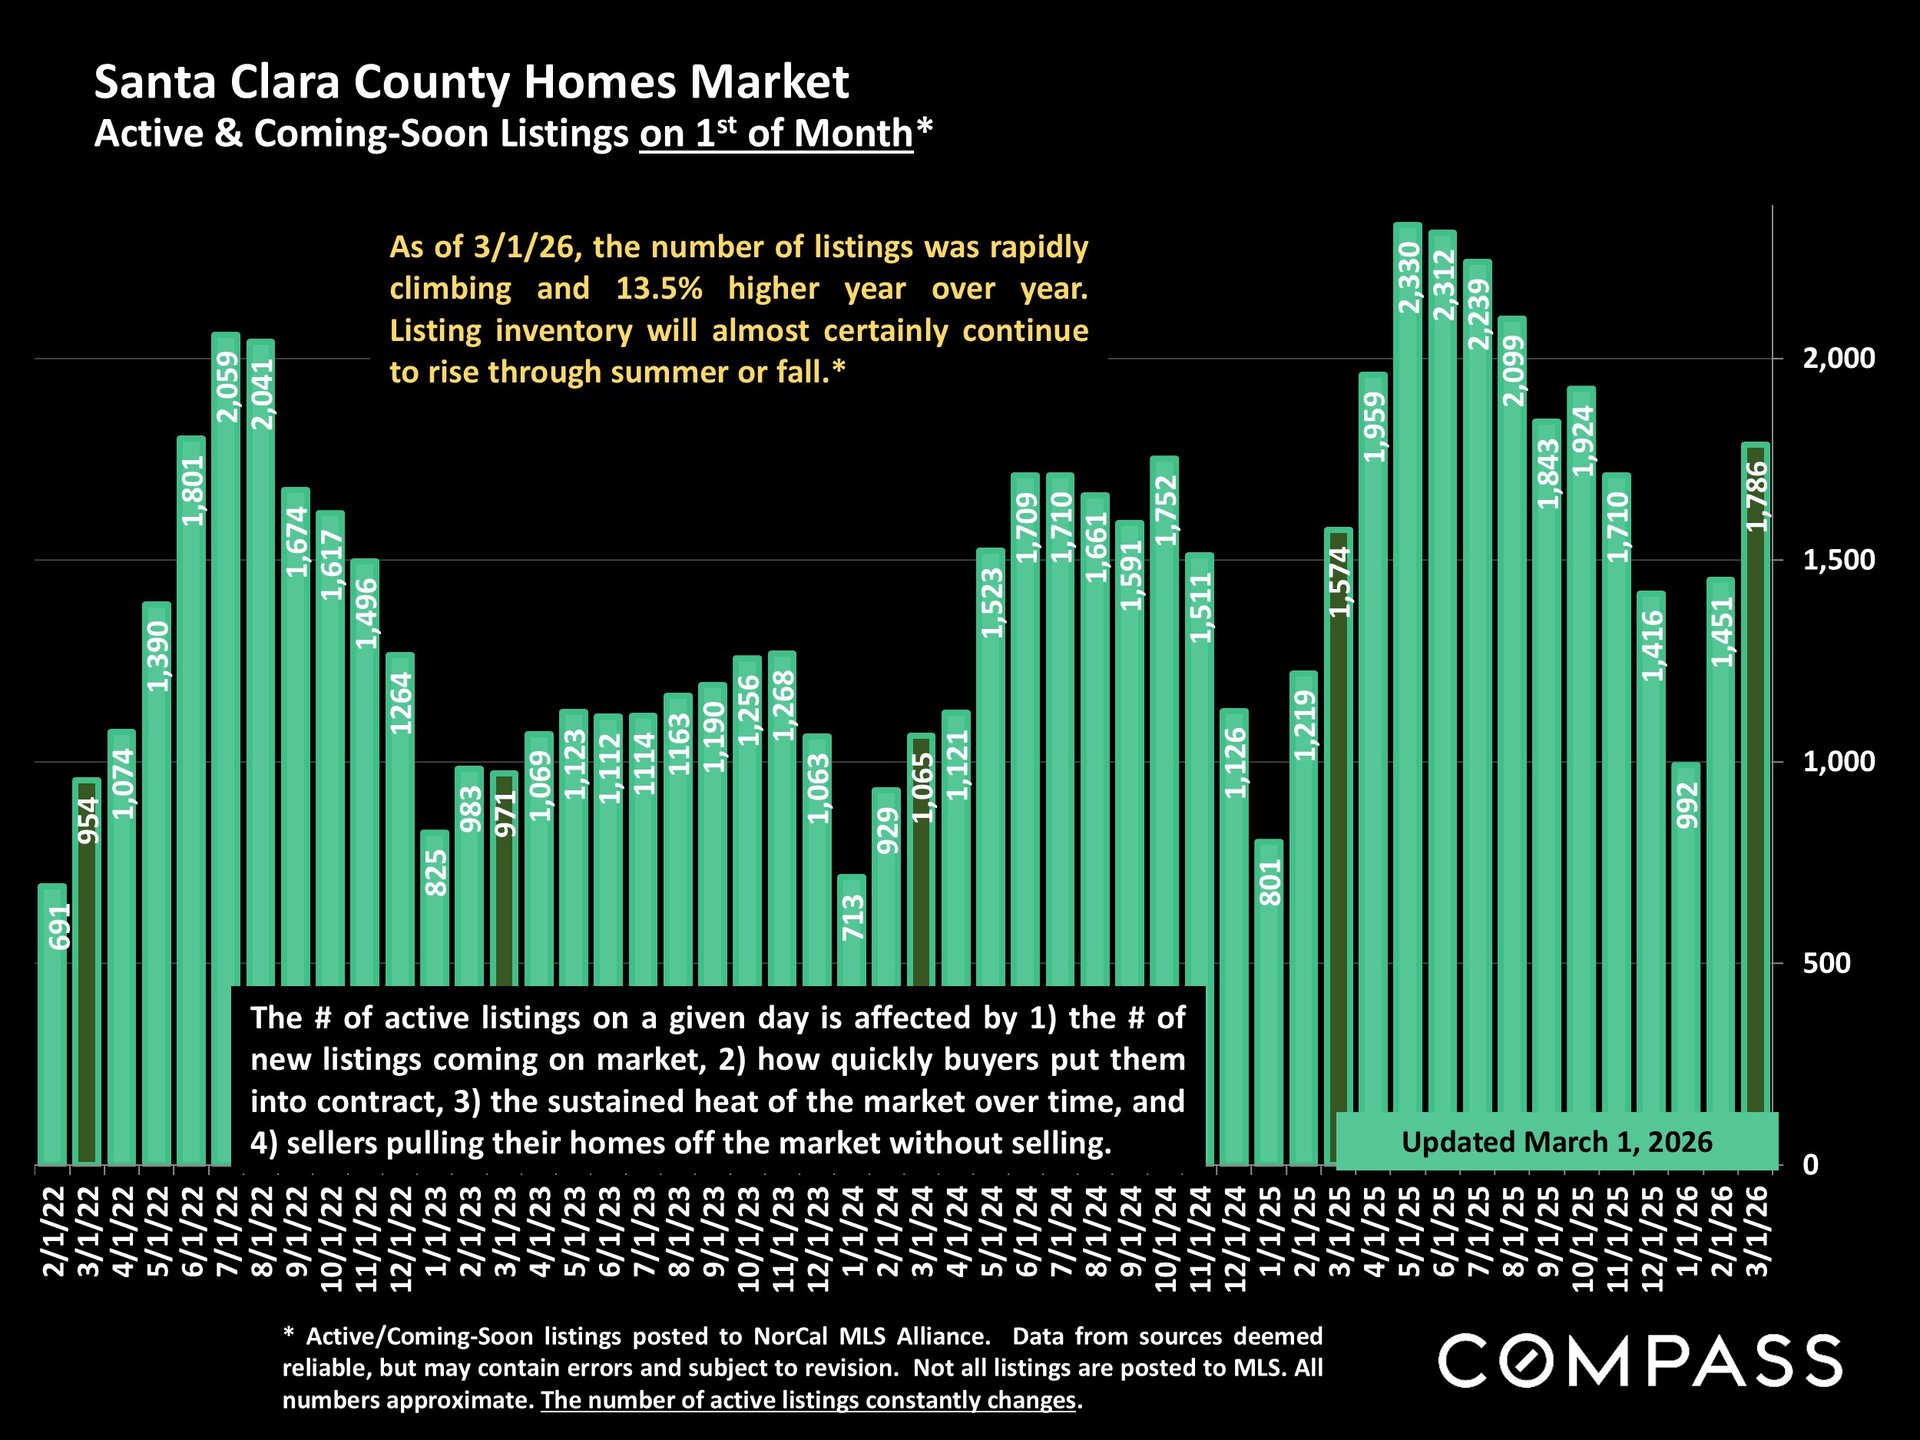
Early Signals Point to a Heated Spring Market in Santa Clara CountyAs was the case last year, houses are seeing stronger market conditions than condos and townhouses, and more affluent buyers continue to play an outsized role in demand and home-price appreciation. $5 million+ home sales hit their highest month-of-February count ever. Moving into spring, rising buyer demand vs. an inadequate supply of homes for sale is heating up the market characterized by increasing buyer competition, faster sales and more overbidding of asking price. The upcoming months are typically the most active of the year and on current trends, conditions are expected to generate upward pressure on home values. Median home sales prices often hit their calendar-year highs in spring, due to the imbalance between supply and demand, as well as a seasonal surge in luxury home sales. The wild card in coming months is what sustained effects, if any, the Iran war may have on inflation, interest rates, financial markets and consumer confidence. Barring an extreme decline in economic conditions, we currently consider a substantial negative impact on the county's housing market unlikely. |
|
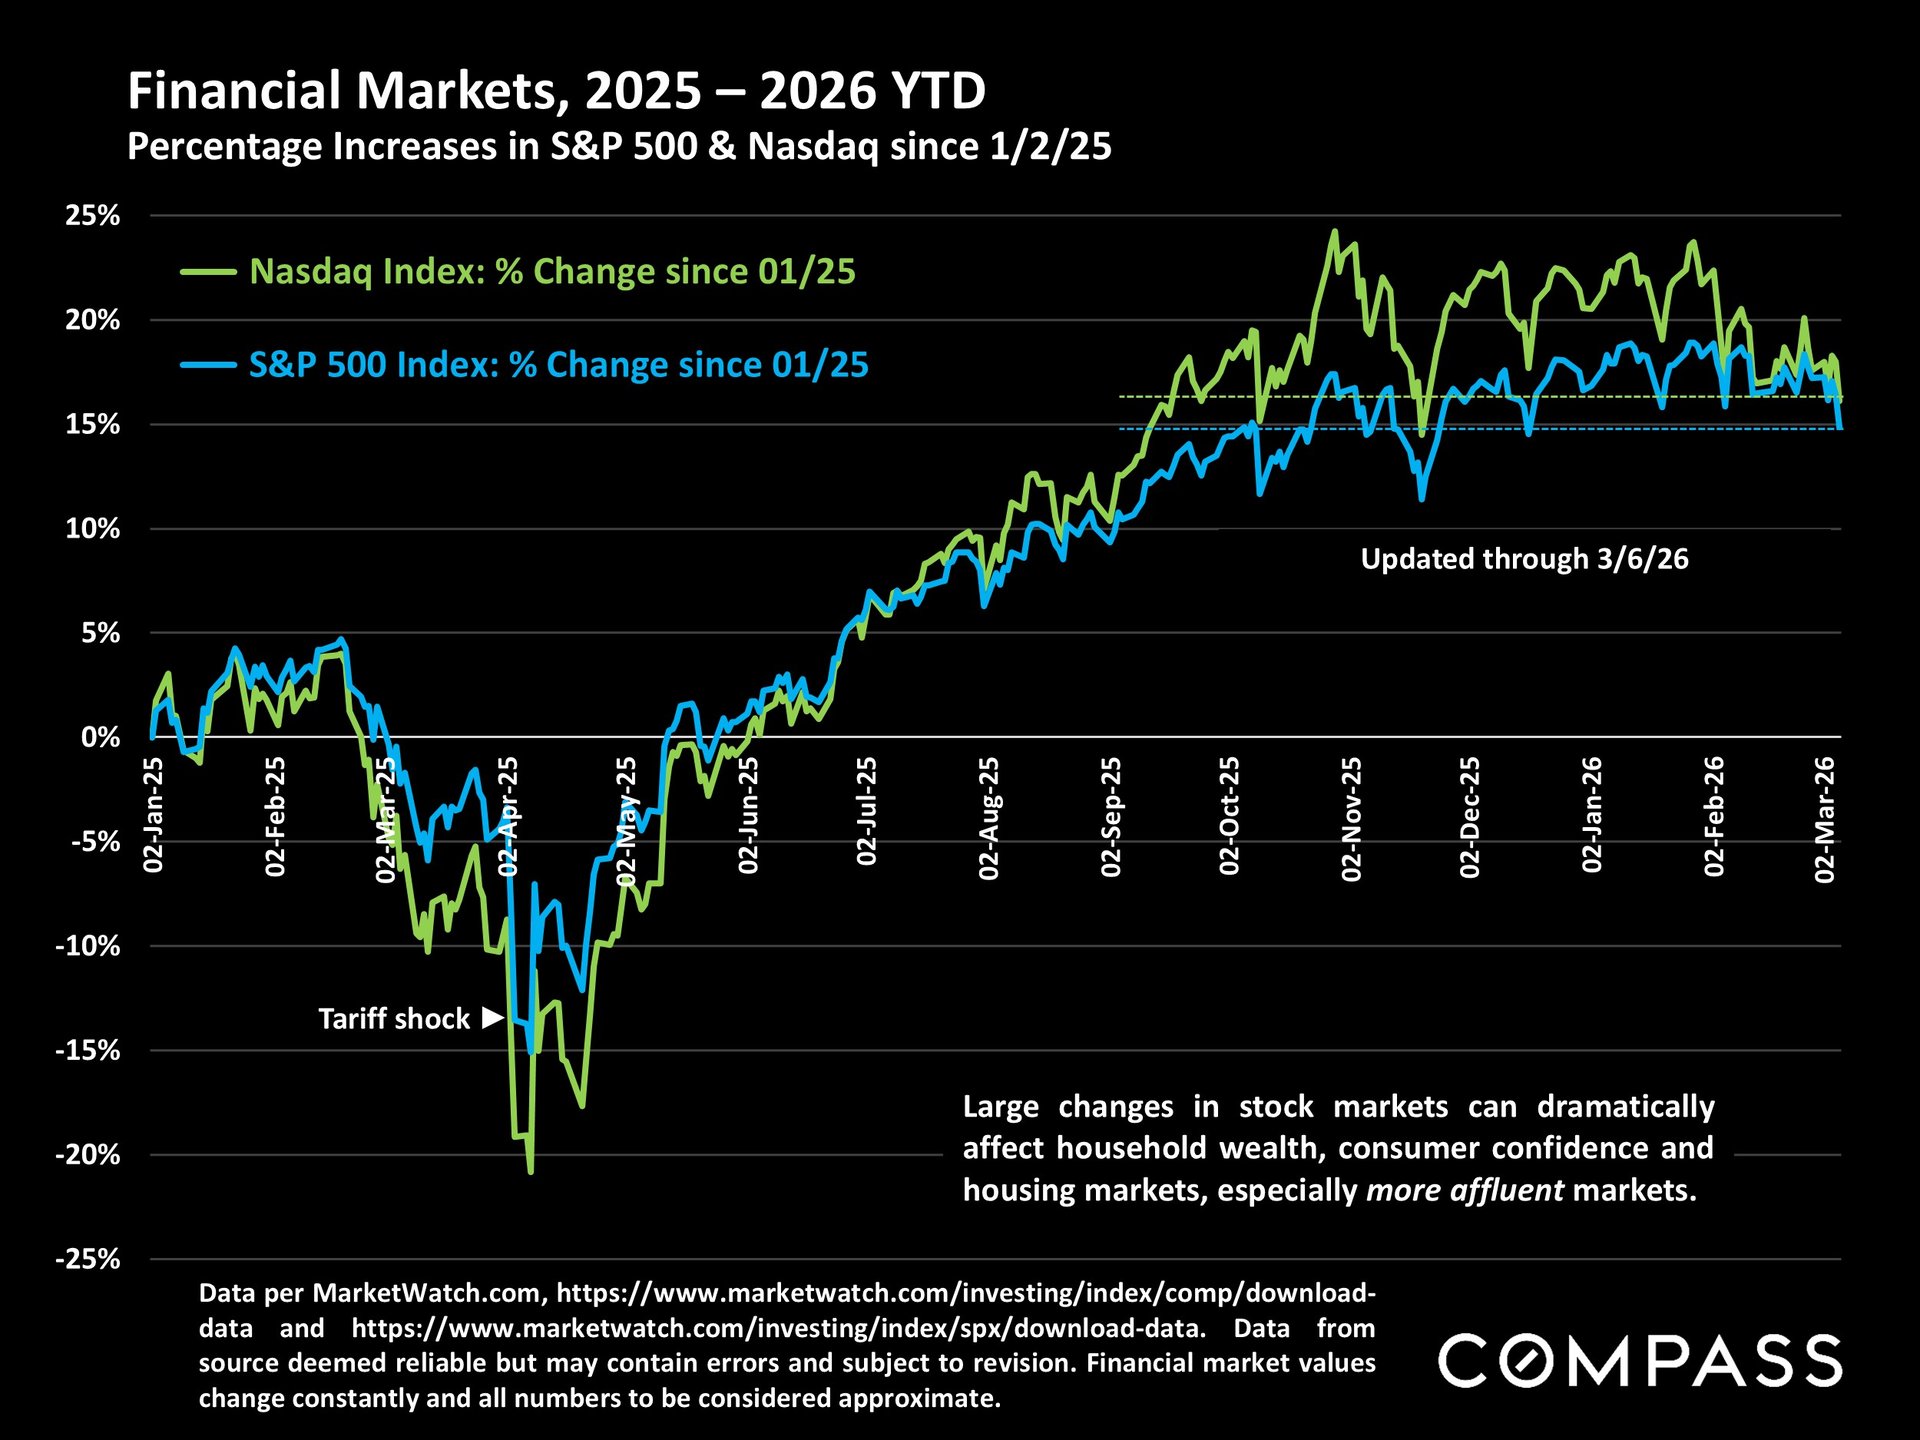
Strong growth in the S&P 500 and Nasdaq through early 2026 has raised household wealth in affluent markets.
|
|
The townhouse and condo market has been relatively slow over the past couple of years, while the luxury segment recorded its highest February sales on record—driven in part by the ongoing AI boom.
|
|
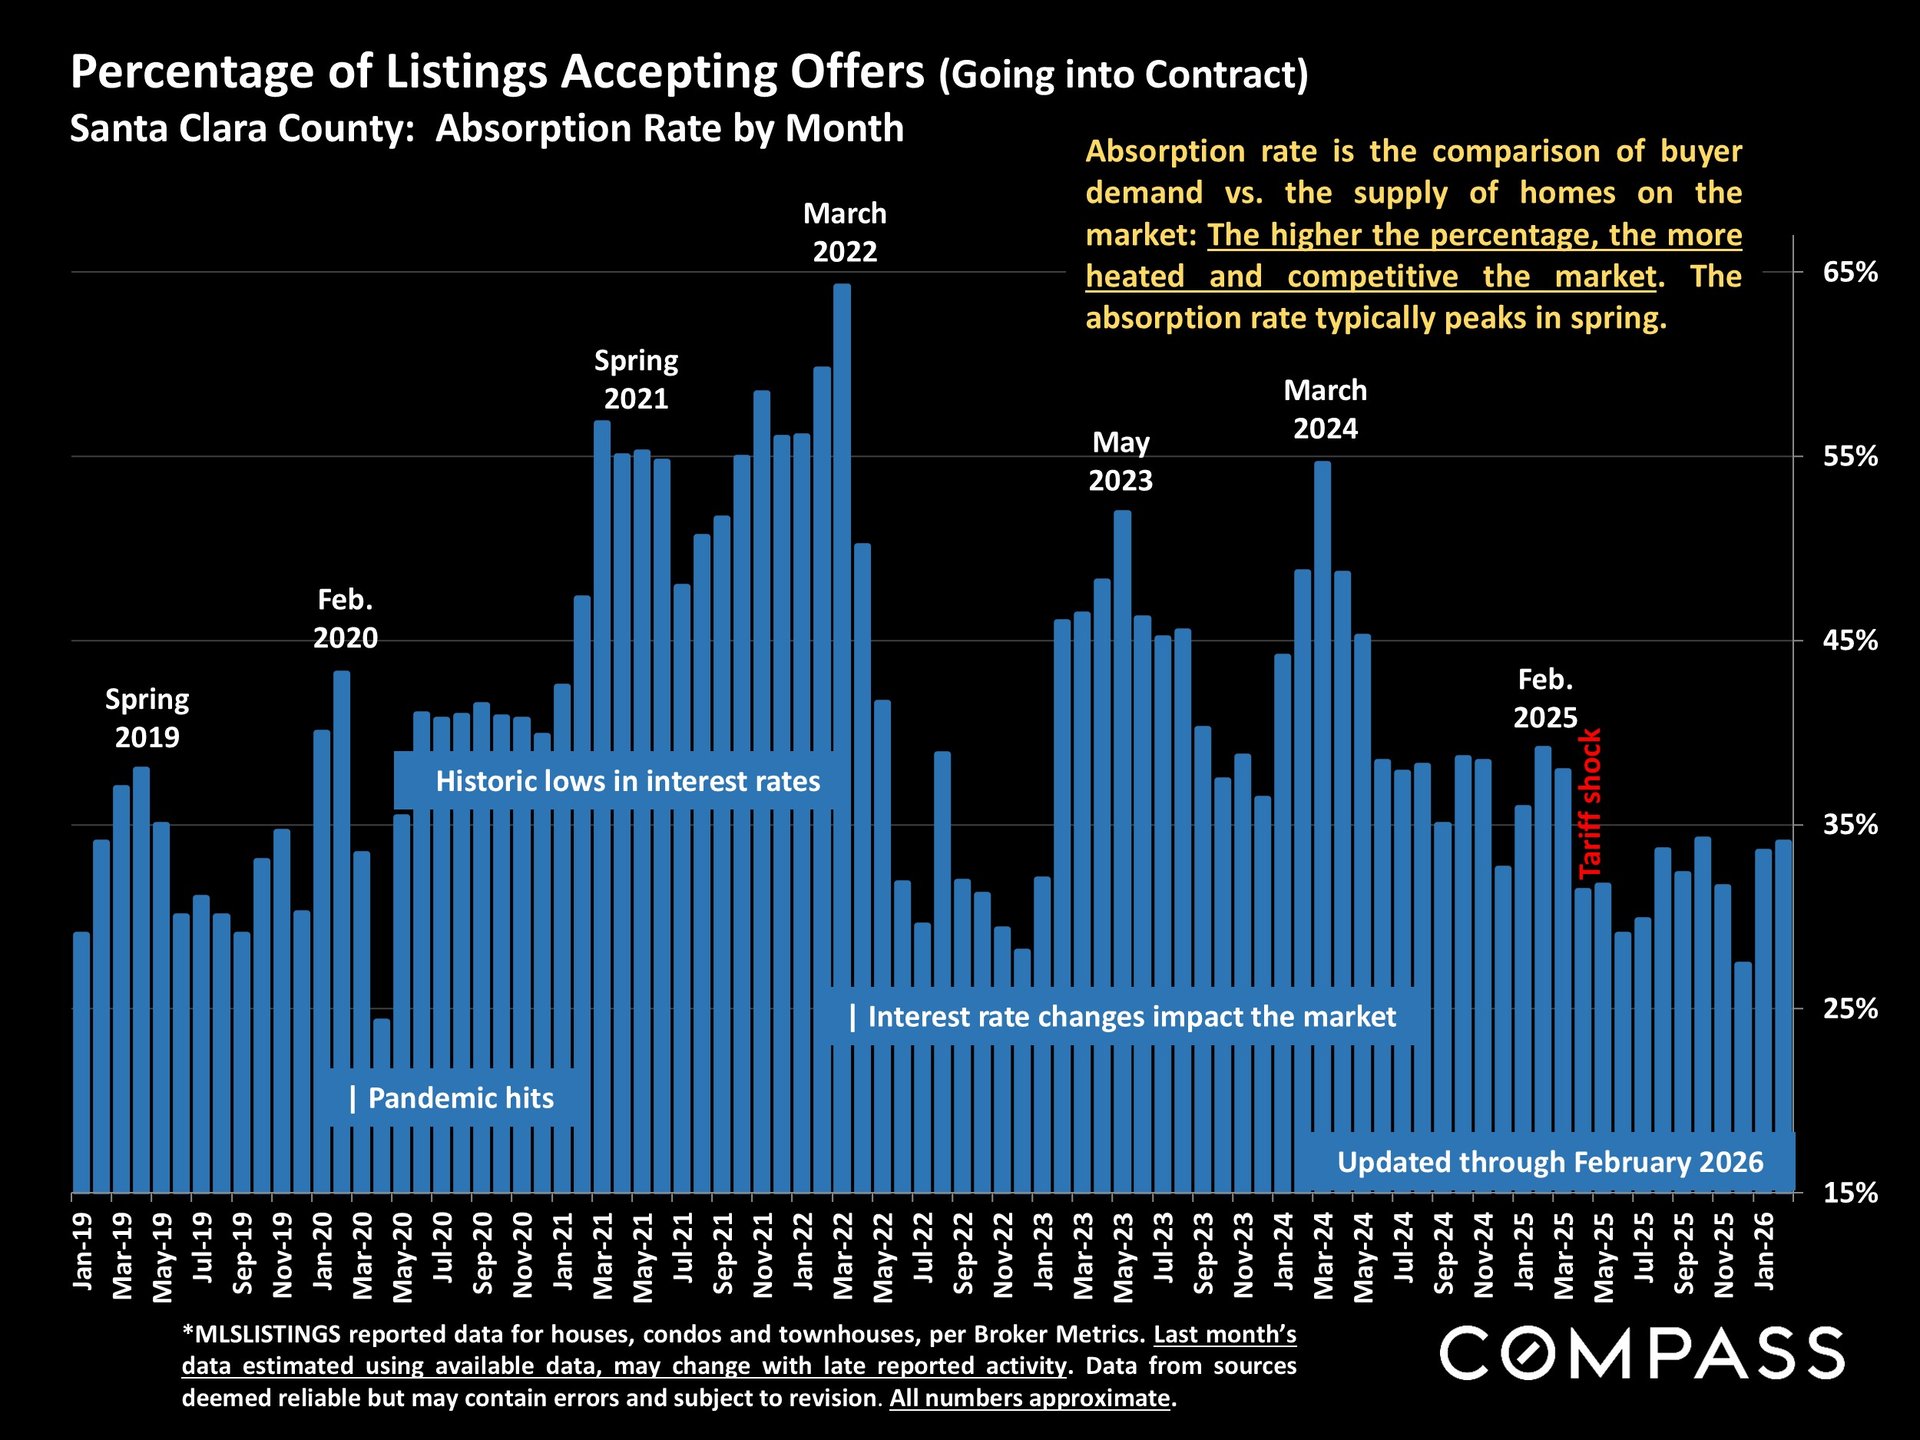
The absorption rate tracks how fast homes are selling. While the market surged during the low-rate boom, it has since stabilized, with today’s conditions reflecting a balance between buyers and sellers.
|
|
Questions? Reach out to us at (650) 988-5114. |
Market Update


Market Update
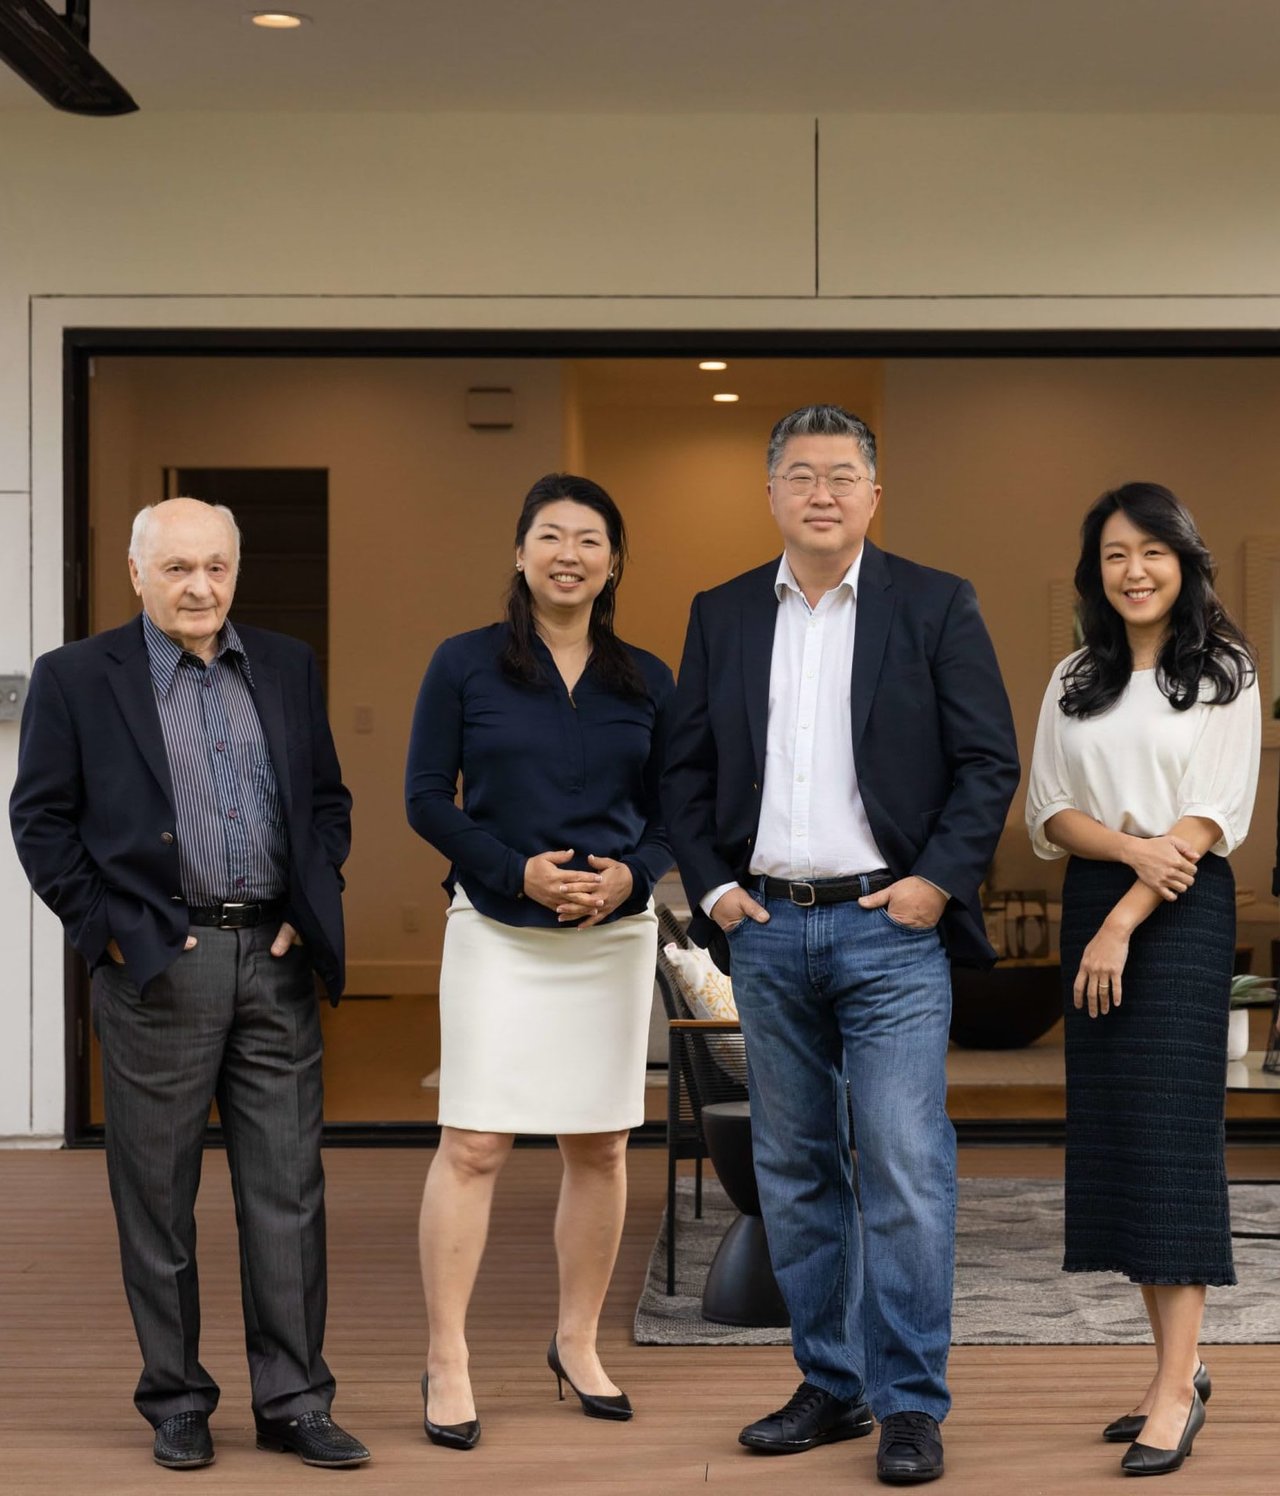
Partner with our dynamic team to unlock the full potential of your real estate endeavors in Silicon Valley. With our tailored approach and in-depth market knowledge, we'll ensure a seamless and extraordinary client experience.
Connect With Our Team to Learn More
19900 Stevens Creek Blvd, #100 Cupertino, CA 95014 David Kim | CA DRE# 01527235 Keller Williams Thrive | CA DRE# 02177478