May 2026 Market Update
Market Update David Kim May 20, 2026
Market Update David Kim May 20, 2026
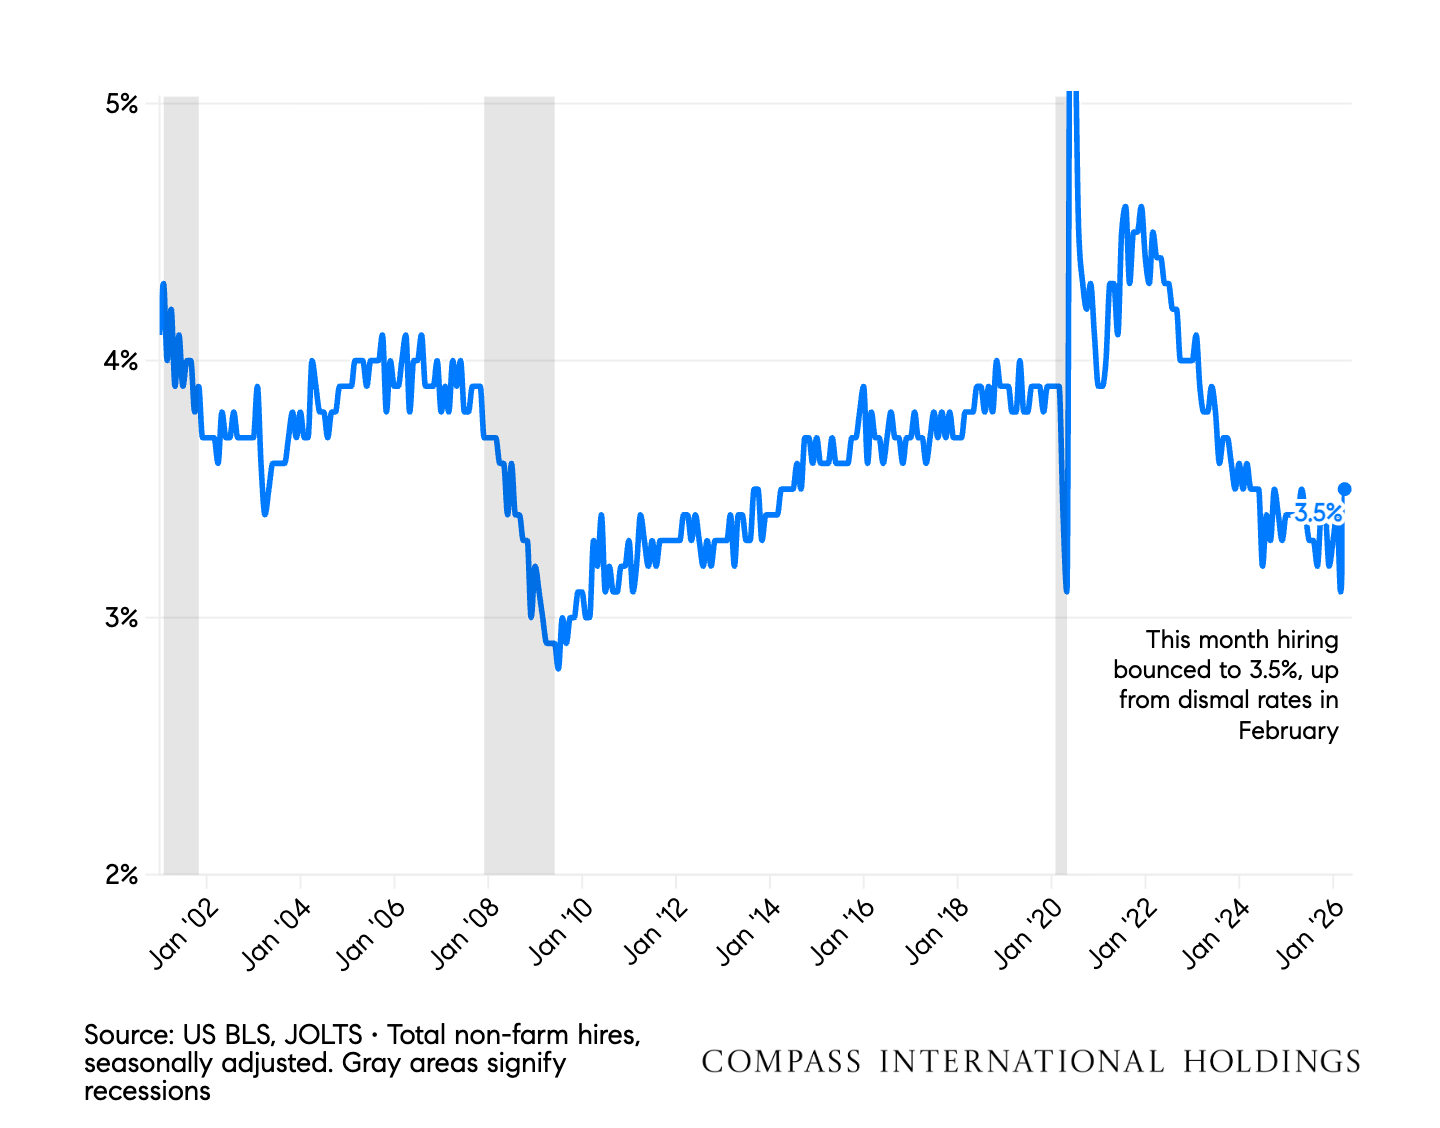
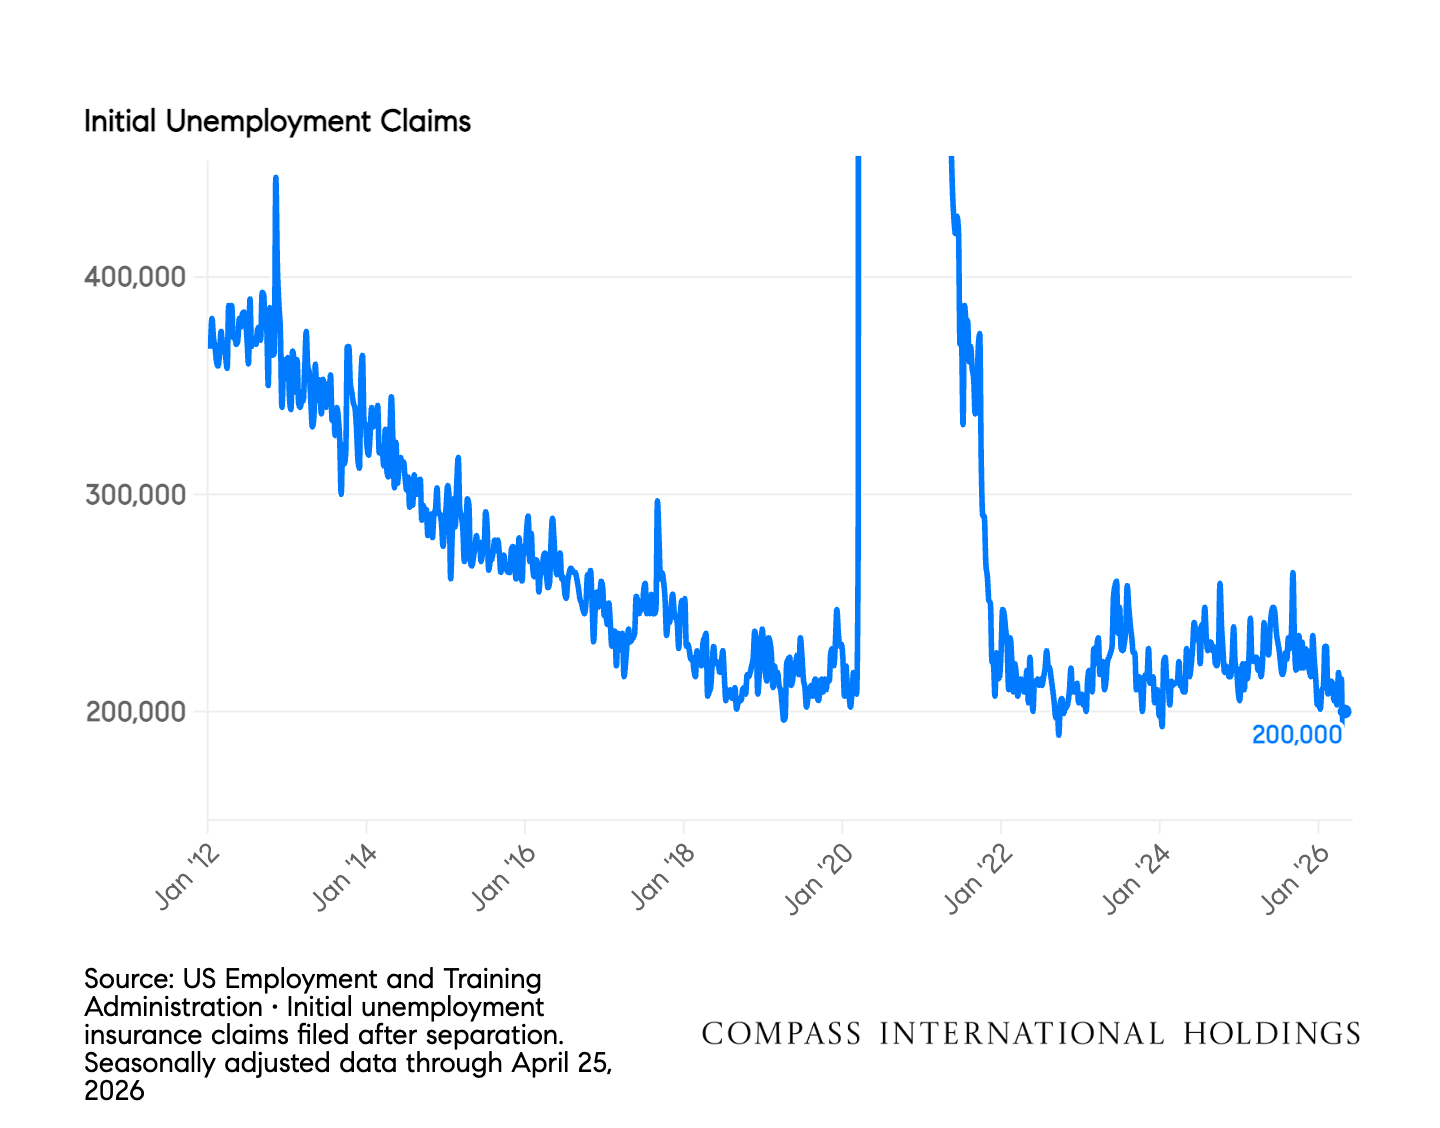
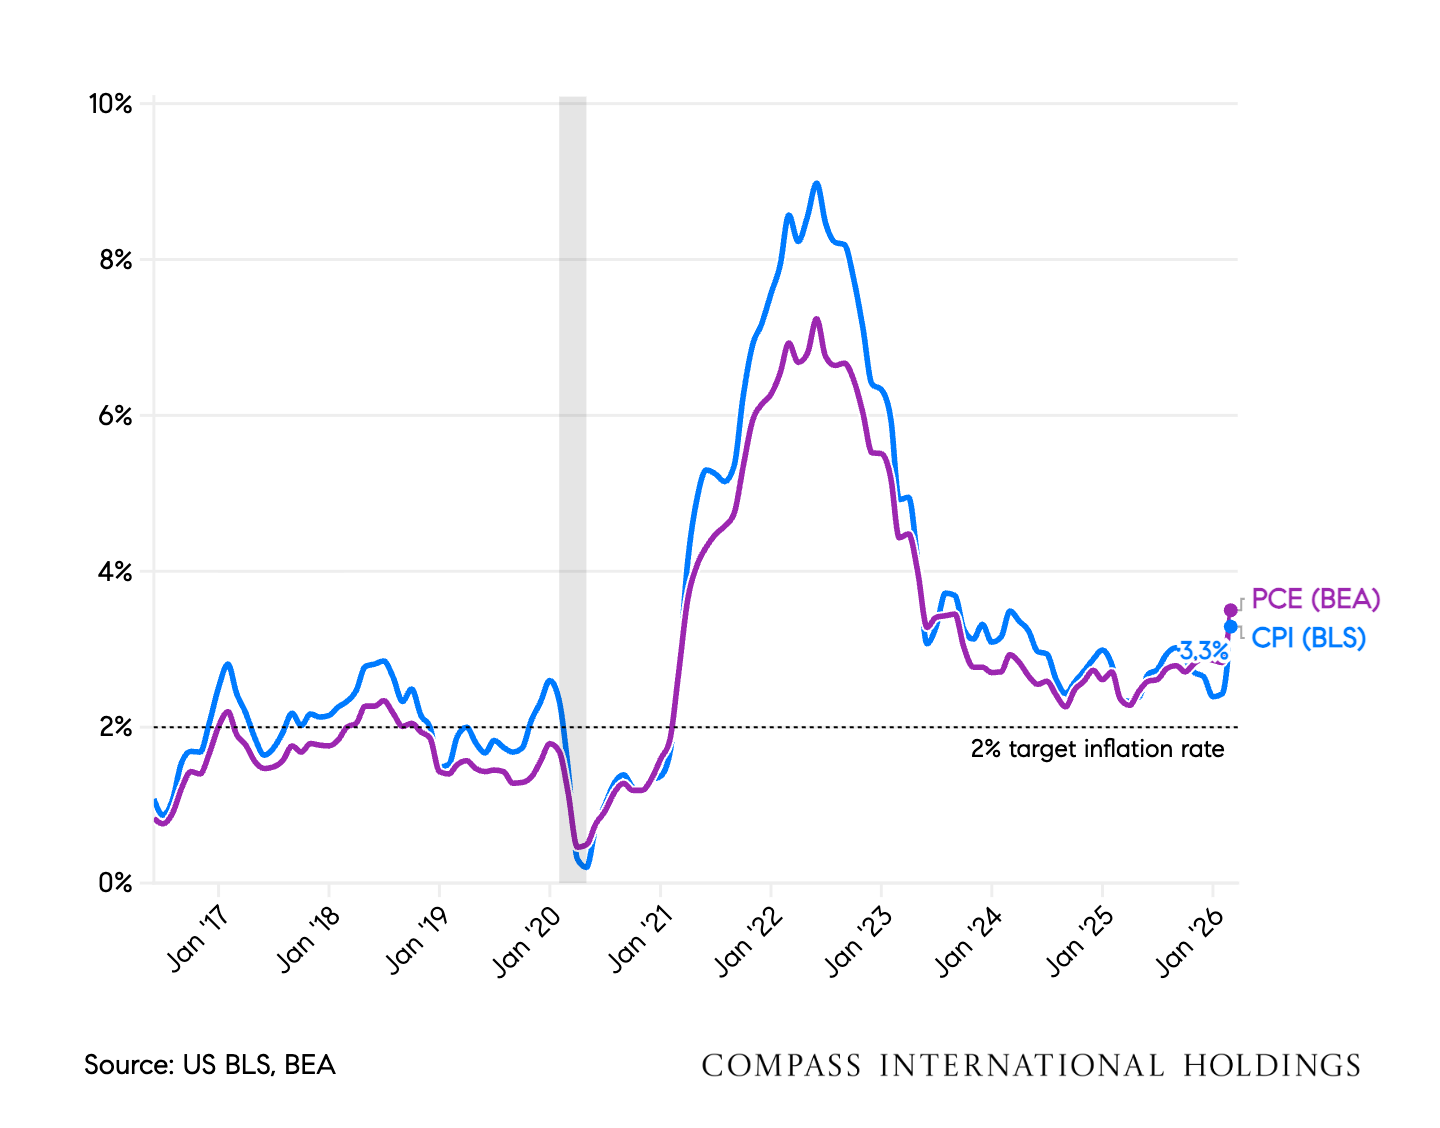
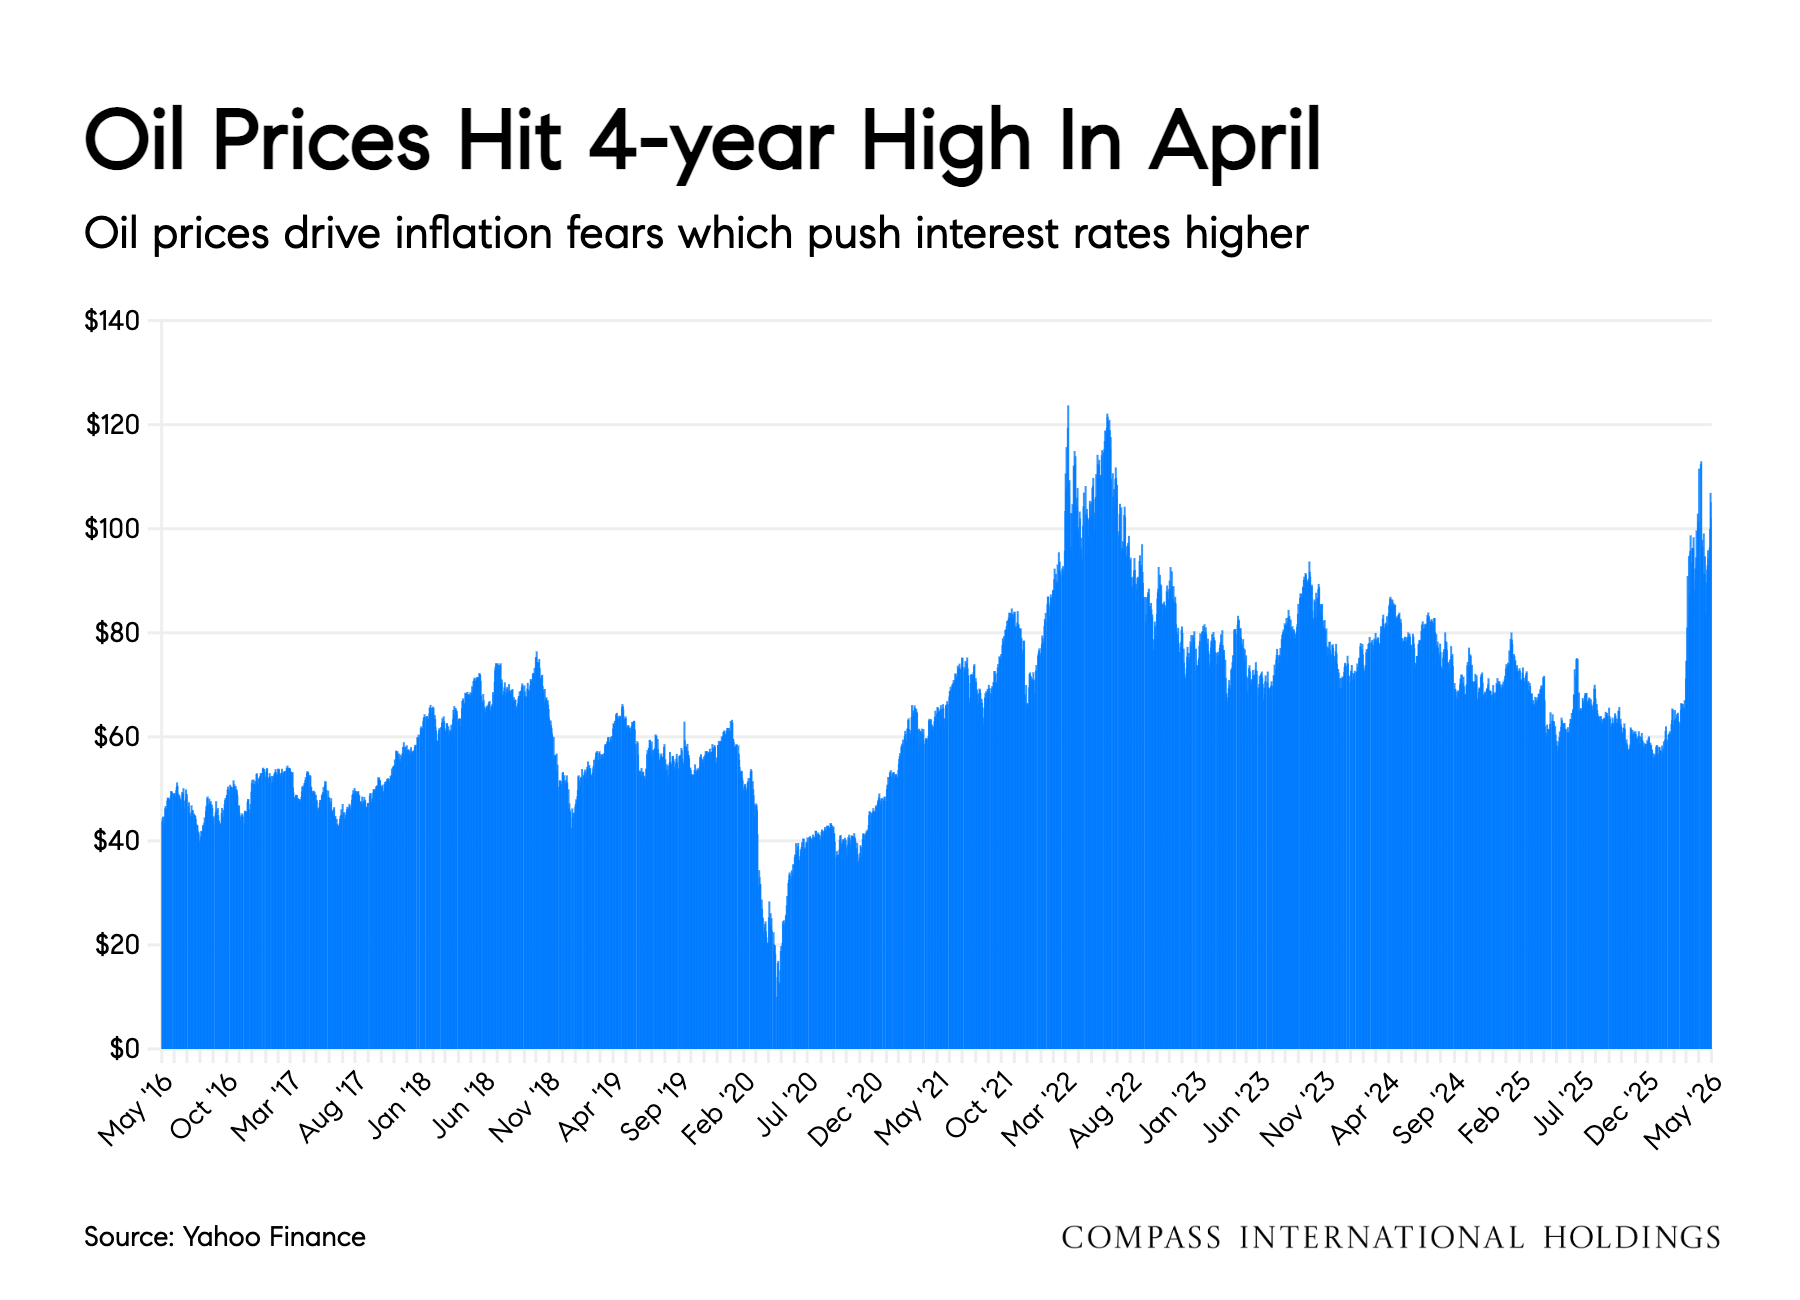
Positive Momentum Meets Economic CrosswindsAs we roll into May 2026, the housing market has (finally) turned in some positive momentum and the economy in general is showing some positive reversals of recent trends. Equities markets have surged to new highs. The long-sluggish labor market has shown some green shoots of improvement. Unemployment and initial jobless claims remain relatively low and in the latest data, hiring and job creation seem to have improved. In this year's housing cycle, we're focused more on the hiring rate in the economy rather than the usual unemployment numbers. Since relocation-for-work is one of the big drivers of housing demand, a very low hiring rate in 2026 continues to be the biggest drag on housing demand after affordability. If companies are not hiring quickly, there are fewer people moving for work. The negative news in this spring's economy is around inflation. Energy costs, tariffs, and government spending are all contributing to rising prices. The war-driven uncertainty has driven energy prices sharply higher and the inflation impacts are only just hitting the economy now. |
|
While unemployment remains relatively low, hiring activity earlier this year slowed to levels we haven’t seen since the pandemic slowdown.
|
|
Energy prices, tariffs, and continued government spending are all contributing to rising costs. Oil prices recently climbed to four-year highs, increasing concerns that inflation could stay elevated longer than expected.
|
|
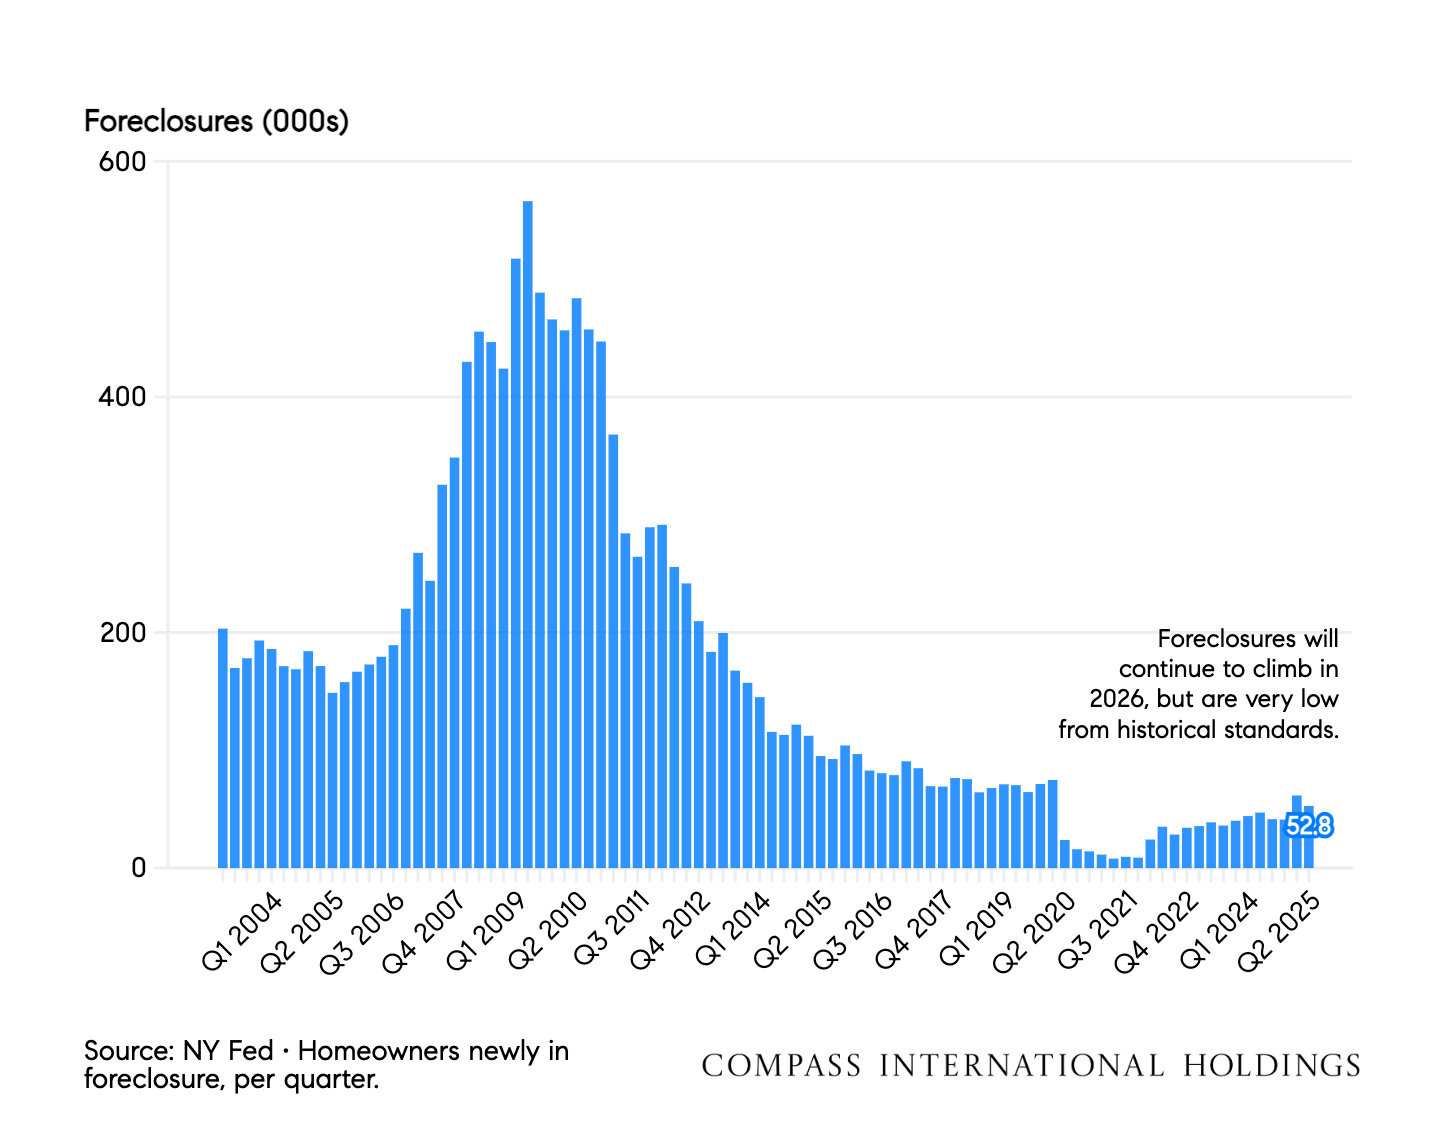
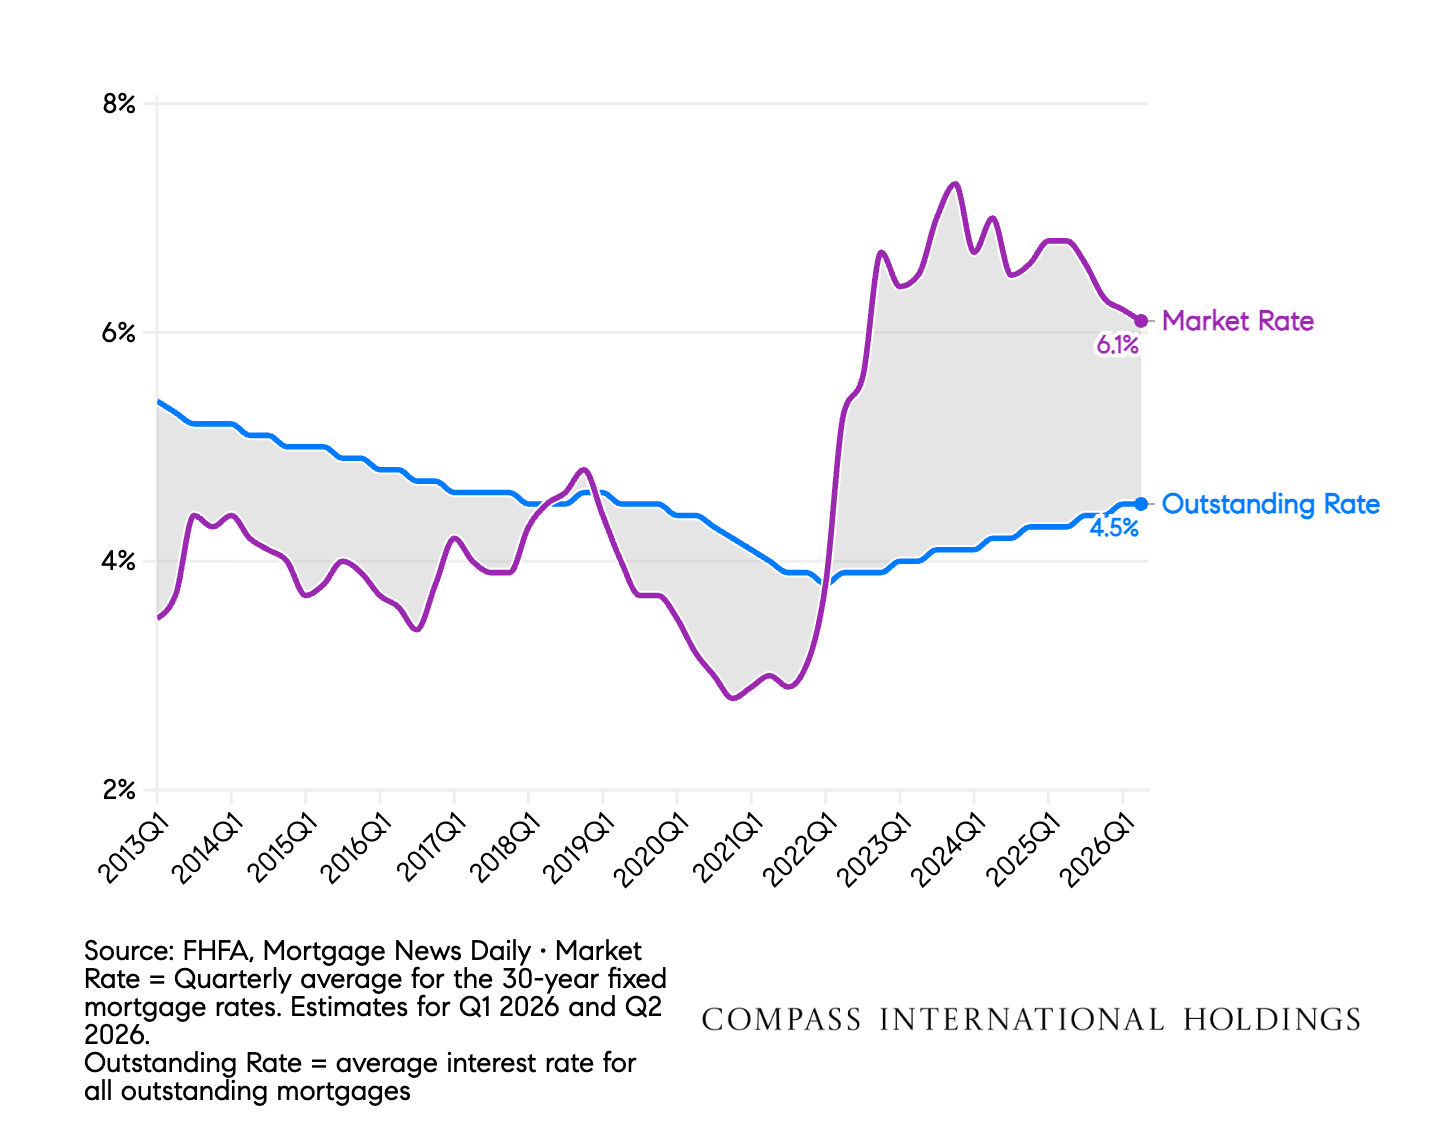
Despite affordability concerns and higher rates, foreclosure activity remains extremely low compared to historical norms. Many homeowners today have substantial equity and locked in low mortgage rates.
|
|
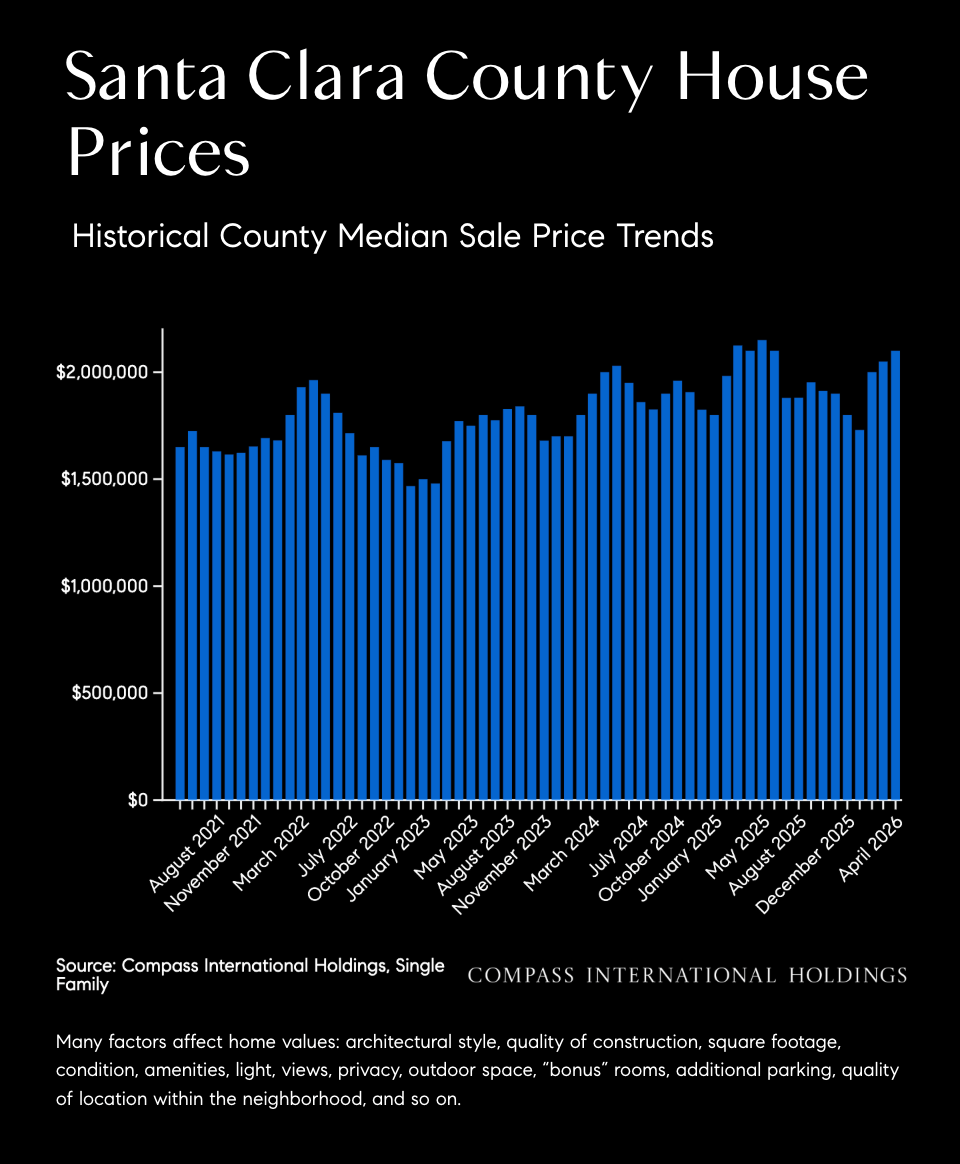
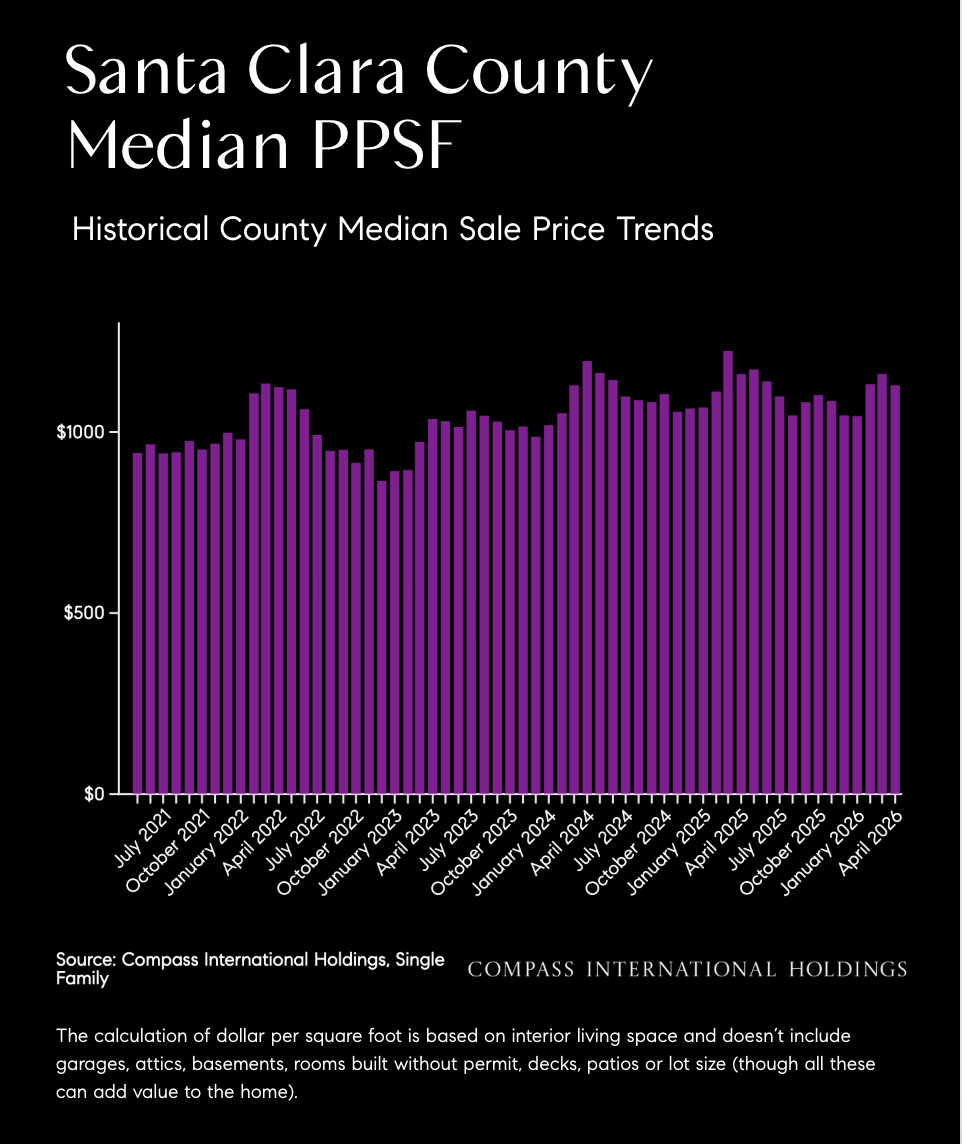
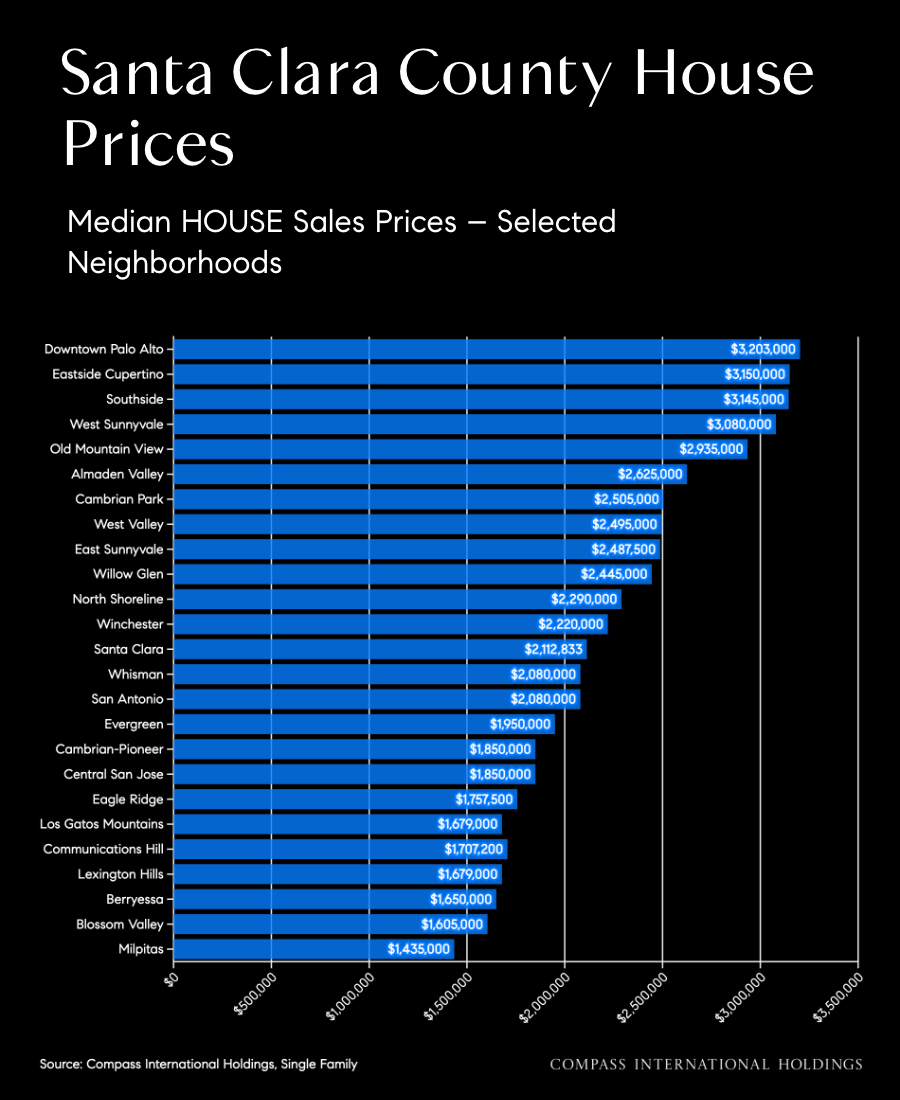
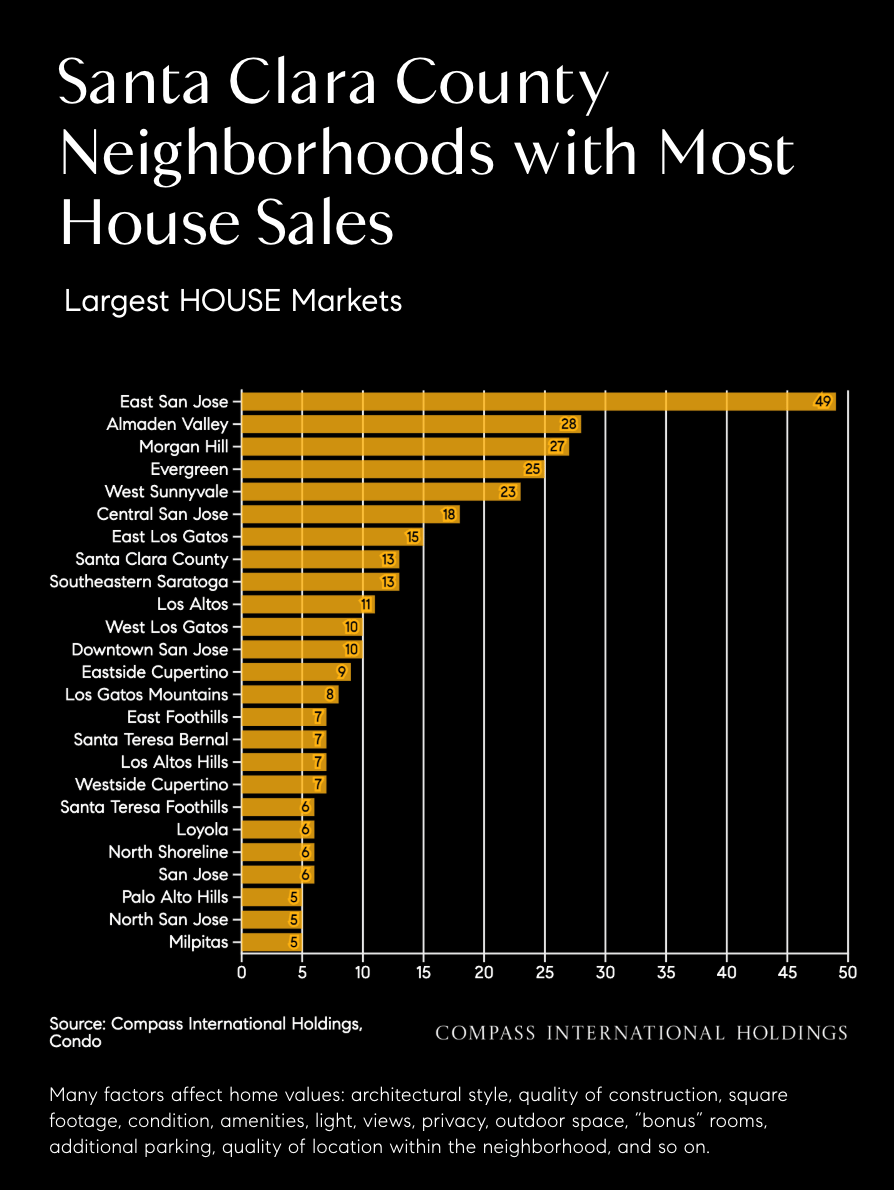
Santa Clara County housing activity has remained relatively steady compared to many other markets.
|
|
While uncertainty remains around rates and inflation, well-prepared buyers and strategically positioned sellers are still finding success in today’s market.
|
|
Questions? Reach out to us at (650) 988-5114. |
Market Update





Market Update
Partner with our dynamic team to unlock the full potential of your real estate endeavors in Silicon Valley. With our tailored approach and in-depth market knowledge, we'll ensure a seamless and extraordinary client experience.
Connect With Our Team to Learn More

19900 Stevens Creek Blvd, #100 Cupertino, CA 95014 David Kim | CA DRE# 01527235 Keller Williams Thrive | CA DRE# 02177478