
July 2026 Market Update
Market Update David Kim July 16, 2026
Market Update David Kim July 16, 2026
AI Wealth Meeting Housing RealityThey Bay Area housing market is the center of national attention this summer. AI-driven wealth has offset persistently higher mortgage rates, pushing demand in a handful of neighborhoods to dramatic levels. The most intense competition is concentrated in San Francisco itself. In June, 44 homes in the city sold for at least $1 million over asking. Sales in San Francisco, San Mateo, and Marin are running well above last years pace. Other parts of the Bay Area are more exposed to AI's other edge: jobs, inflation, and rates. Most buyers need a mortgage, and rates have stayed elevated – though still below last year's level. Nationally, inflation remains well above what policymakers and bond markets are comfortable with, driven by energy costs, government spending, and quite possibly the AI investment boom itself. Mortgage rates spent another month near 6.5%. Santa Clara County is feeling a different edge: Bay Area tech companies have cut 58,000 jobs so far in 2026, and in the South Bay, inventory is climbing while average sale prices trail last year. In many ways, the Bay Area is leading the nation's housing story in both directions – new wealth pulling the top of the market to record heights, while job insecurity and high rates weigh on buyers further down. It's always wort watching the Bay Area markets closely as we often signal where the rest of the country is headed next. |
Higher inflation is keeping mortgage rates elevated, but strong stock market gains continue to support buyer confidence–especially in the Bay Area. |
Bay Area job growth is slowing, but continued national employment gains suggest the economy remains supportive of housing demand.
|
Increasing inventory and steady buyer demand are creating steps towards a more balanced market, though the condo market is still volatile.
|
Seasonal price moderation is evident, but Santa Clara County home values continue to remain near historic highs.
|
Condo prices have remained relatively stable overall, despite shifting market conditions. |
Questions? Reach out to us at (650) 988-5114. |


Market Update

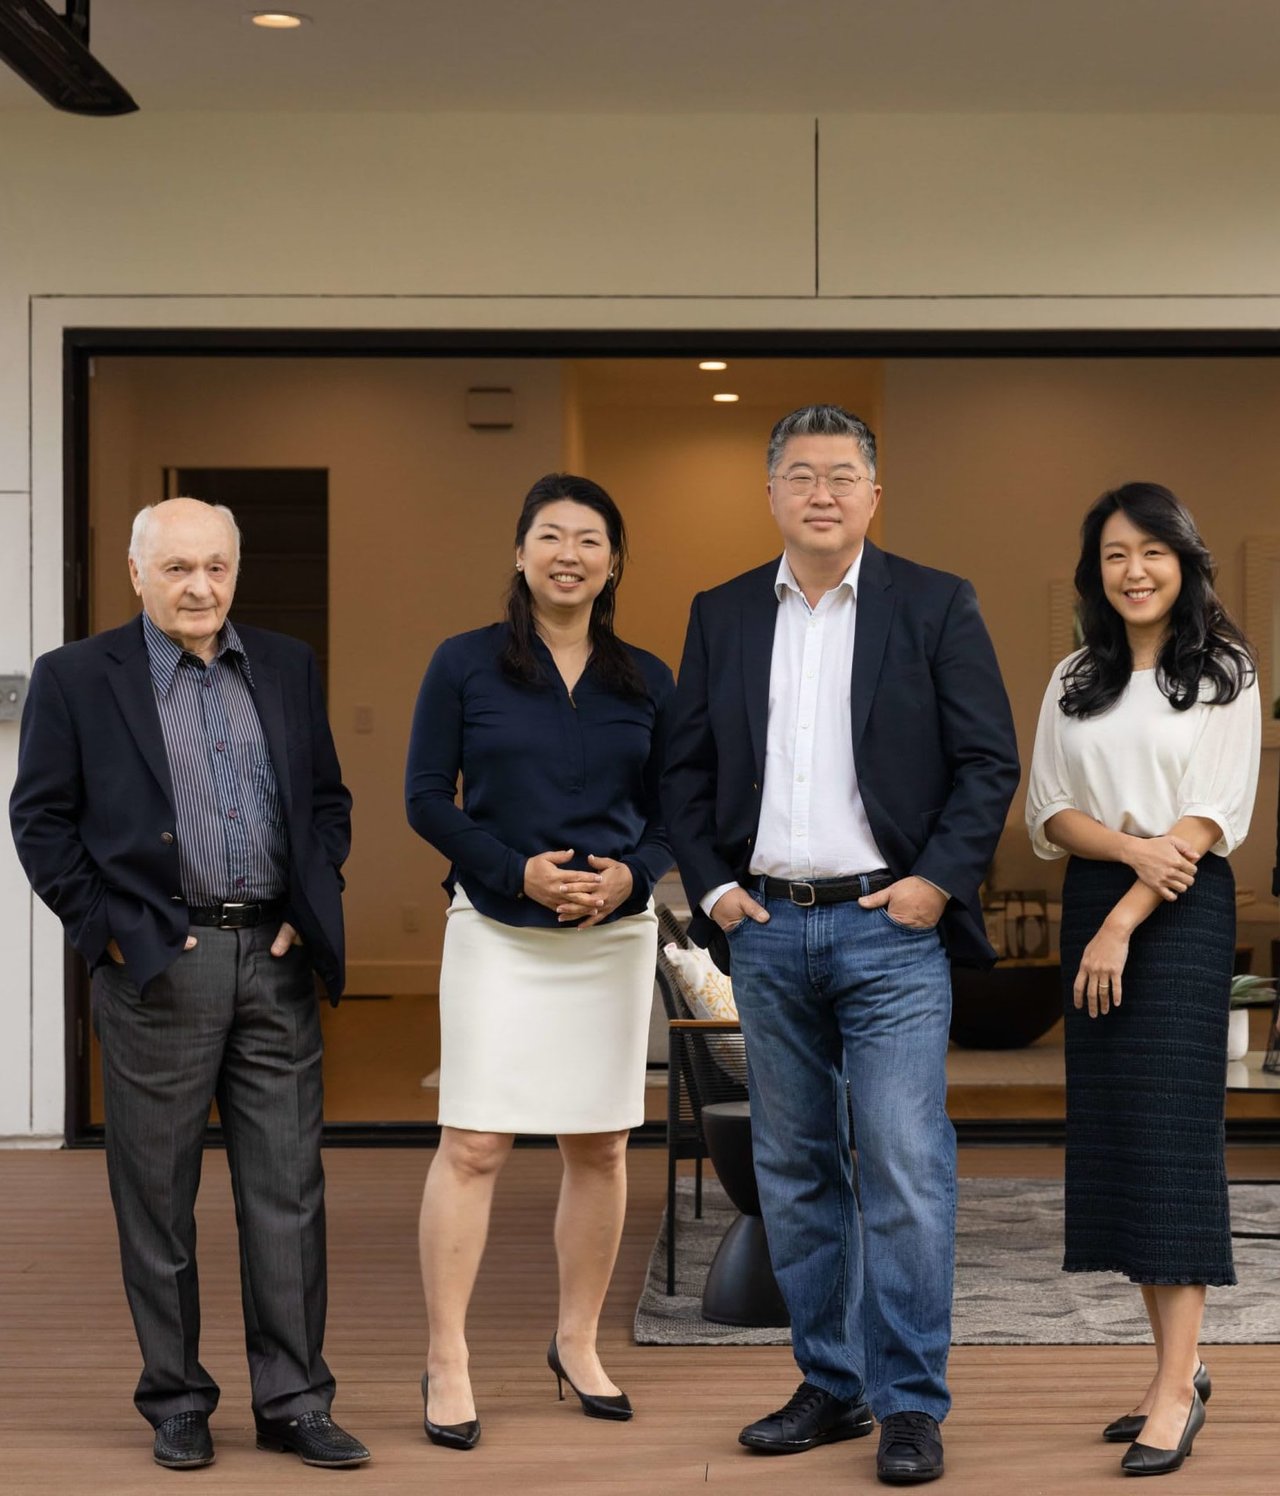
Partner with our dynamic team to unlock the full potential of your real estate endeavors in Silicon Valley. With our tailored approach and in-depth market knowledge, we'll ensure a seamless and extraordinary client experience.
Connect With Our Team to Learn More
19900 Stevens Creek Blvd, #100 Cupertino, CA 95014 David Kim | CA DRE# 01527235 Keller Williams Thrive | CA DRE# 02177478


