
April 2026 Bay Area Market Update & Trends
Market Update David Kim April 20, 2026
Market Update David Kim April 20, 2026
Shrugging Off War, Buyer Demand Continues to Strengthen Moving Deeper Into SpringDespite significant negative economic effects from the Iran war–rising interest rates, volatile financial markets, soaring oil and gas prices, and fears of increased inflation–Bay Area real estate markets saw relatively little impact in March. What effects that occurred usually impacted less expensive markets more sensitive to interest rate increases. So far, there has been no reaction comparable to what occurred last year with the tariff shock, and as of April 8th, virtually all economic indicators were turning in positive directions with the cease fire announcement. The numbers of new listings, listings for sale and listings going into contract in March climbed substantially from February. Overbidding increased and listings sold faster. The second quarter is usually the most active of the year, often seeing the highest median sales prices. As has been the case for the last 2 years, affluent markets typically remained more heated than less expensive markets, the house and townhouse markets considerably stronger than condo markets. |
|
The cost of entry varies wildly across the county, from entry-level neighborhoods to elite luxury areas.
|
|
Inventory is climbing rapidly, providing more options for buyers even as the market remains historically tight.
|
|
Buyer demand remains high enough to drive overbidding, particularly for single-family homes.
|
|
Outside forces like global conflict and interest rate volatility are the primary "wild cards" for 2026.
|
|
Questions? Reach out to us at (650) 988-5114. |
Market Update

Market Update
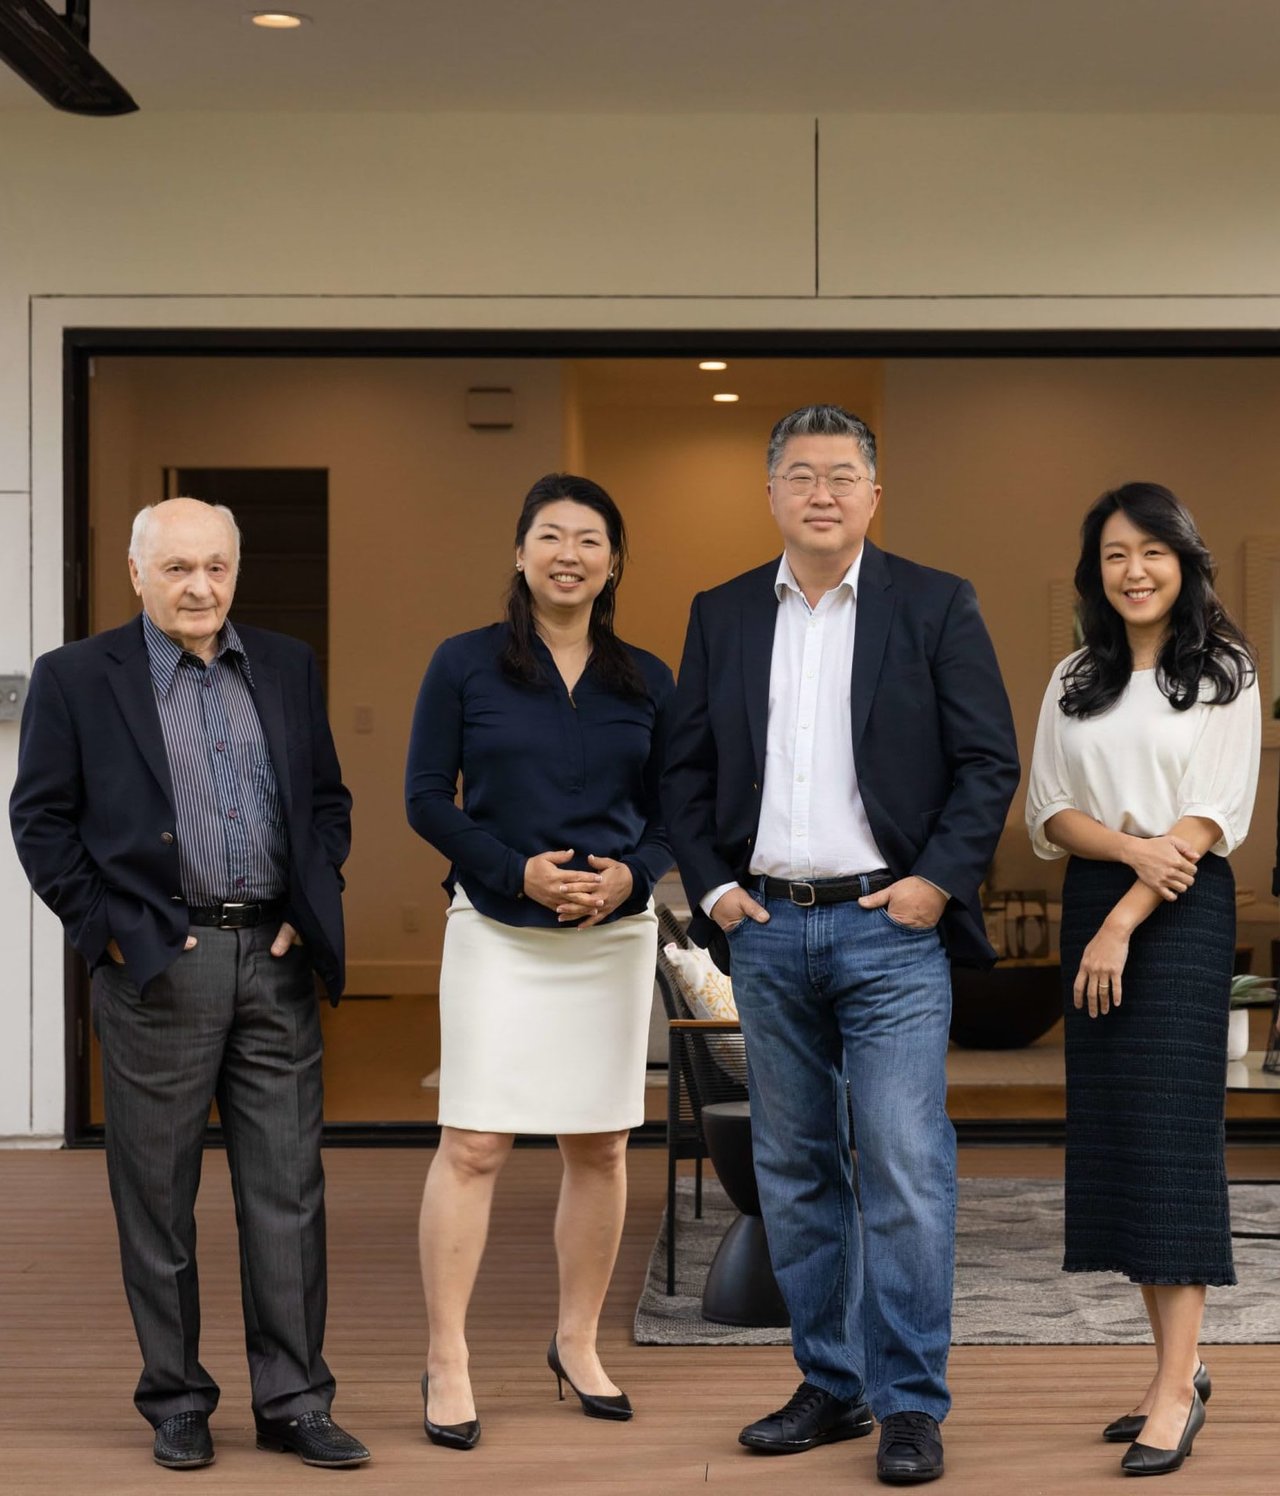
Partner with our dynamic team to unlock the full potential of your real estate endeavors in Silicon Valley. With our tailored approach and in-depth market knowledge, we'll ensure a seamless and extraordinary client experience.
Connect With Our Team to Learn More
19900 Stevens Creek Blvd, #100 Cupertino, CA 95014 David Kim | CA DRE# 01527235 Keller Williams Thrive | CA DRE# 02177478


