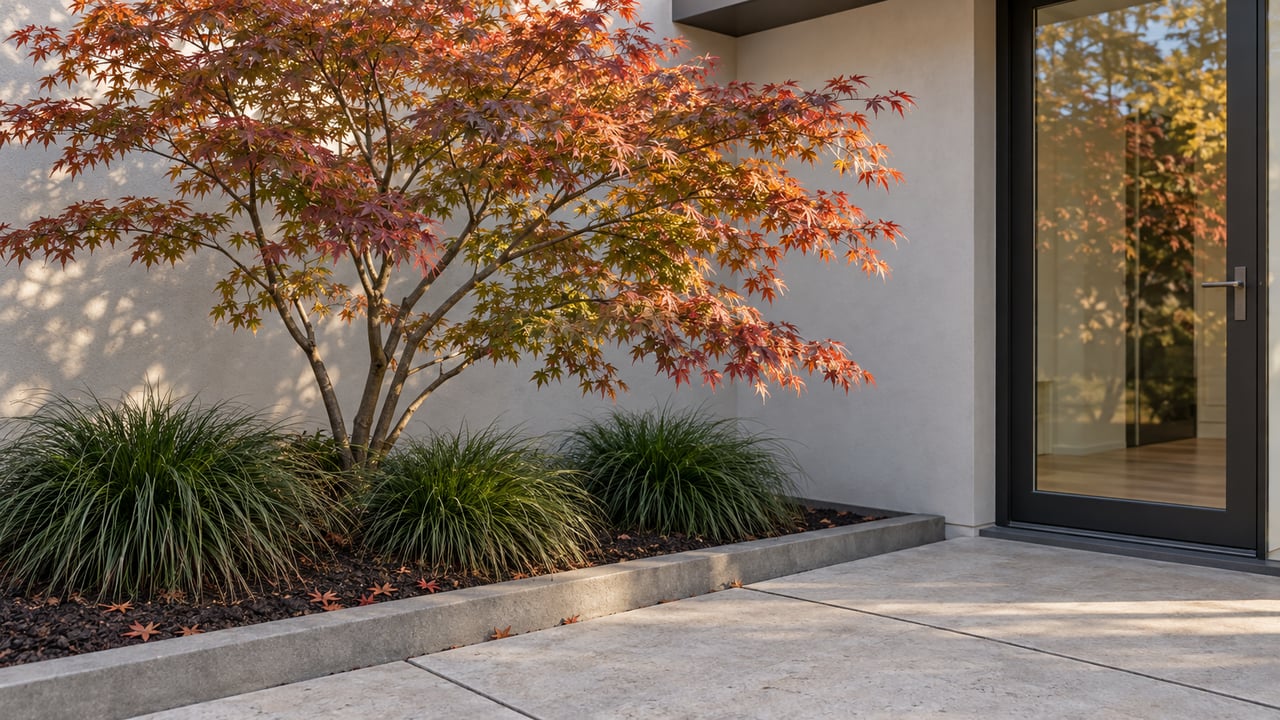
Open-plan dining area with a sculptural staircase, wood-accented kitchen, and glass doors to a patio.

November 2022 Market Update - What's Ahead

David Kim December 22, 2022

Here's our latest market update for Santa Clara County this month.
 
In the last few weeks, the interest rates have dropped a bit. However, today on  Nov 28th, the Fed stated that the inflation flight could last until 2024. Below are the updated charts. 

If you have any questions about the information shared in this report or how the financial market could impact real estate, feel free to reach out to me at 650.988.5114.
 
- David Kim
 
Santa Clara County real estate November 2022 report cover, with a sunset over a lake and COMPASS branding.
 
November 2022 Bay Area housing market update noting declining sales and cooling demand.
 
Chart of Santa Clara County house prices since 1990, peaking near $2 million in 2022.
 
Santa Clara County two-bedroom condo price chart, with prices through October 2022 and a $740,000 median.
 
Santa Clara County housing market table comparing Summer–Fall 2022 statistics across ten cities.
 
Santa Clara County Summer-Fall 2022 housing market snapshot with city, condo, townhouse, and neighborhood statistics.
 
San Jose housing market statistics table for Summer–Fall 2022, broken down by neighborhood, condos, and townhouses.
 
Bar chart of Santa Clara County monthly home sales, 2018–2022, highlighting a 40% year-over-year October decline.
 
Chart of Santa Clara County $3 million-plus home sales from 2018 to 2022, with an October 2022 year-over-year decline of about 40%.
 
Chart of mortgage rates from 1976 to 2022, with a steep rise to 6.95% in November 2022.
 
Chart of Santa Clara County home sales over list price, declining to 41% in October 2022 after a spring 2022 peak.
 
Bar chart of Santa Clara County sale prices versus original list prices, peaking in March 2022 before falling below list price.
 
Santa Clara County chart of average days on market for sold listings, January 2019 to October 2022.
 
Bar chart of Santa Clara County active listings’ average days on market by price segment, ranging from 45 to 89 days.
 
Santa Clara County new listings chart, showing spring peaks and winter drops from 2018 through 2022.
 
Bar chart of Santa Clara County active and coming-soon listings, peaking at 2,059 in July 2022 before falling to 1,496 in November.
 
Santa Clara County active listings chart showing monthly inventory trends from 2017 to 2022.
 
Chart of Santa Clara County listings accepting offers, January 2019–October 2022, showing a 42% year-over-year decline in October 2022.
 
Chart of Santa Clara County listing price reductions, with monthly red bars and marked seasonal peaks from 2018 to 2022.
 
Santa Clara County inventory infographic charts months of supply from 2017 to 2022, highlighting pandemic lows and a later market cooldown.
 
Chart of Santa Clara County housing inventory by price segment, ranging from 1.2 to 5.3 months of supply.
 
Bar chart of Bay Area listings withdrawn without selling, rising to 12% by October 2022.
 
National home buyer and seller survey excerpts on moving distance, locations, buyer ages, financing, and seller tenure.
 
Real estate market statistics definitions and Compass report disclaimer.

Work With Us

Partner with our dynamic team to unlock the full potential of your real estate endeavors in Silicon Valley. With our tailored approach and in-depth market knowledge, we'll ensure a seamless and extraordinary client experience.

Follow Us