David Kim Group

December 2025 Market Update

Market Update David Kim December 19, 2025

Winter Slowdown and Strategic Opportunities: December Market Conditions

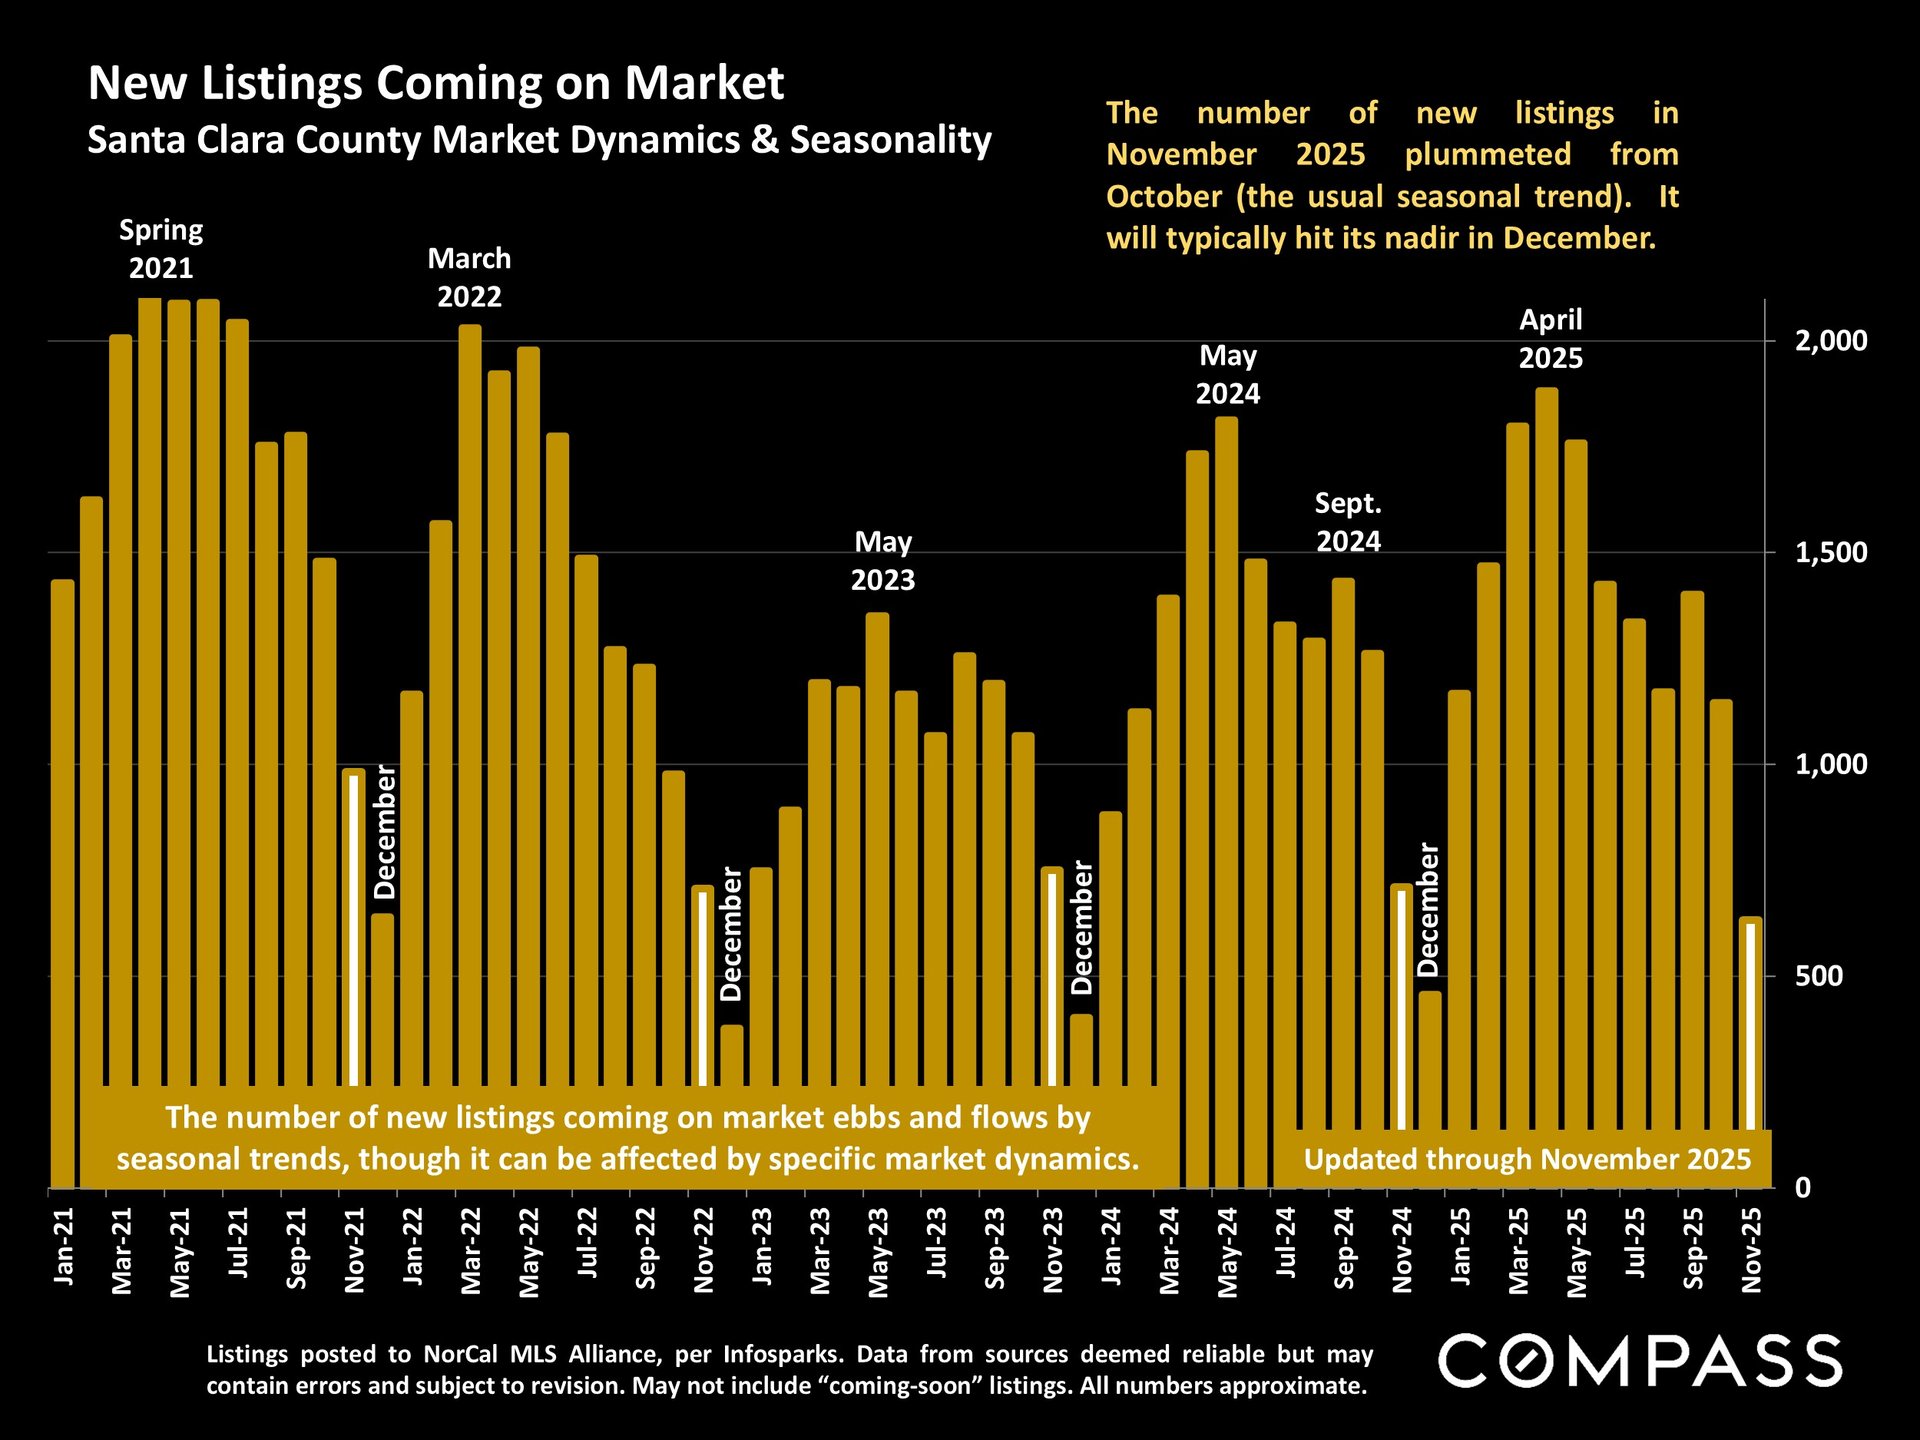
The real estate market began its usual mid-winter holiday season slowdown in November, market by a substantial decline in both listing and sales activity. This contraction typically accelerates through December - normally the year's slowest month - before the market begins to wake up in mid-January.

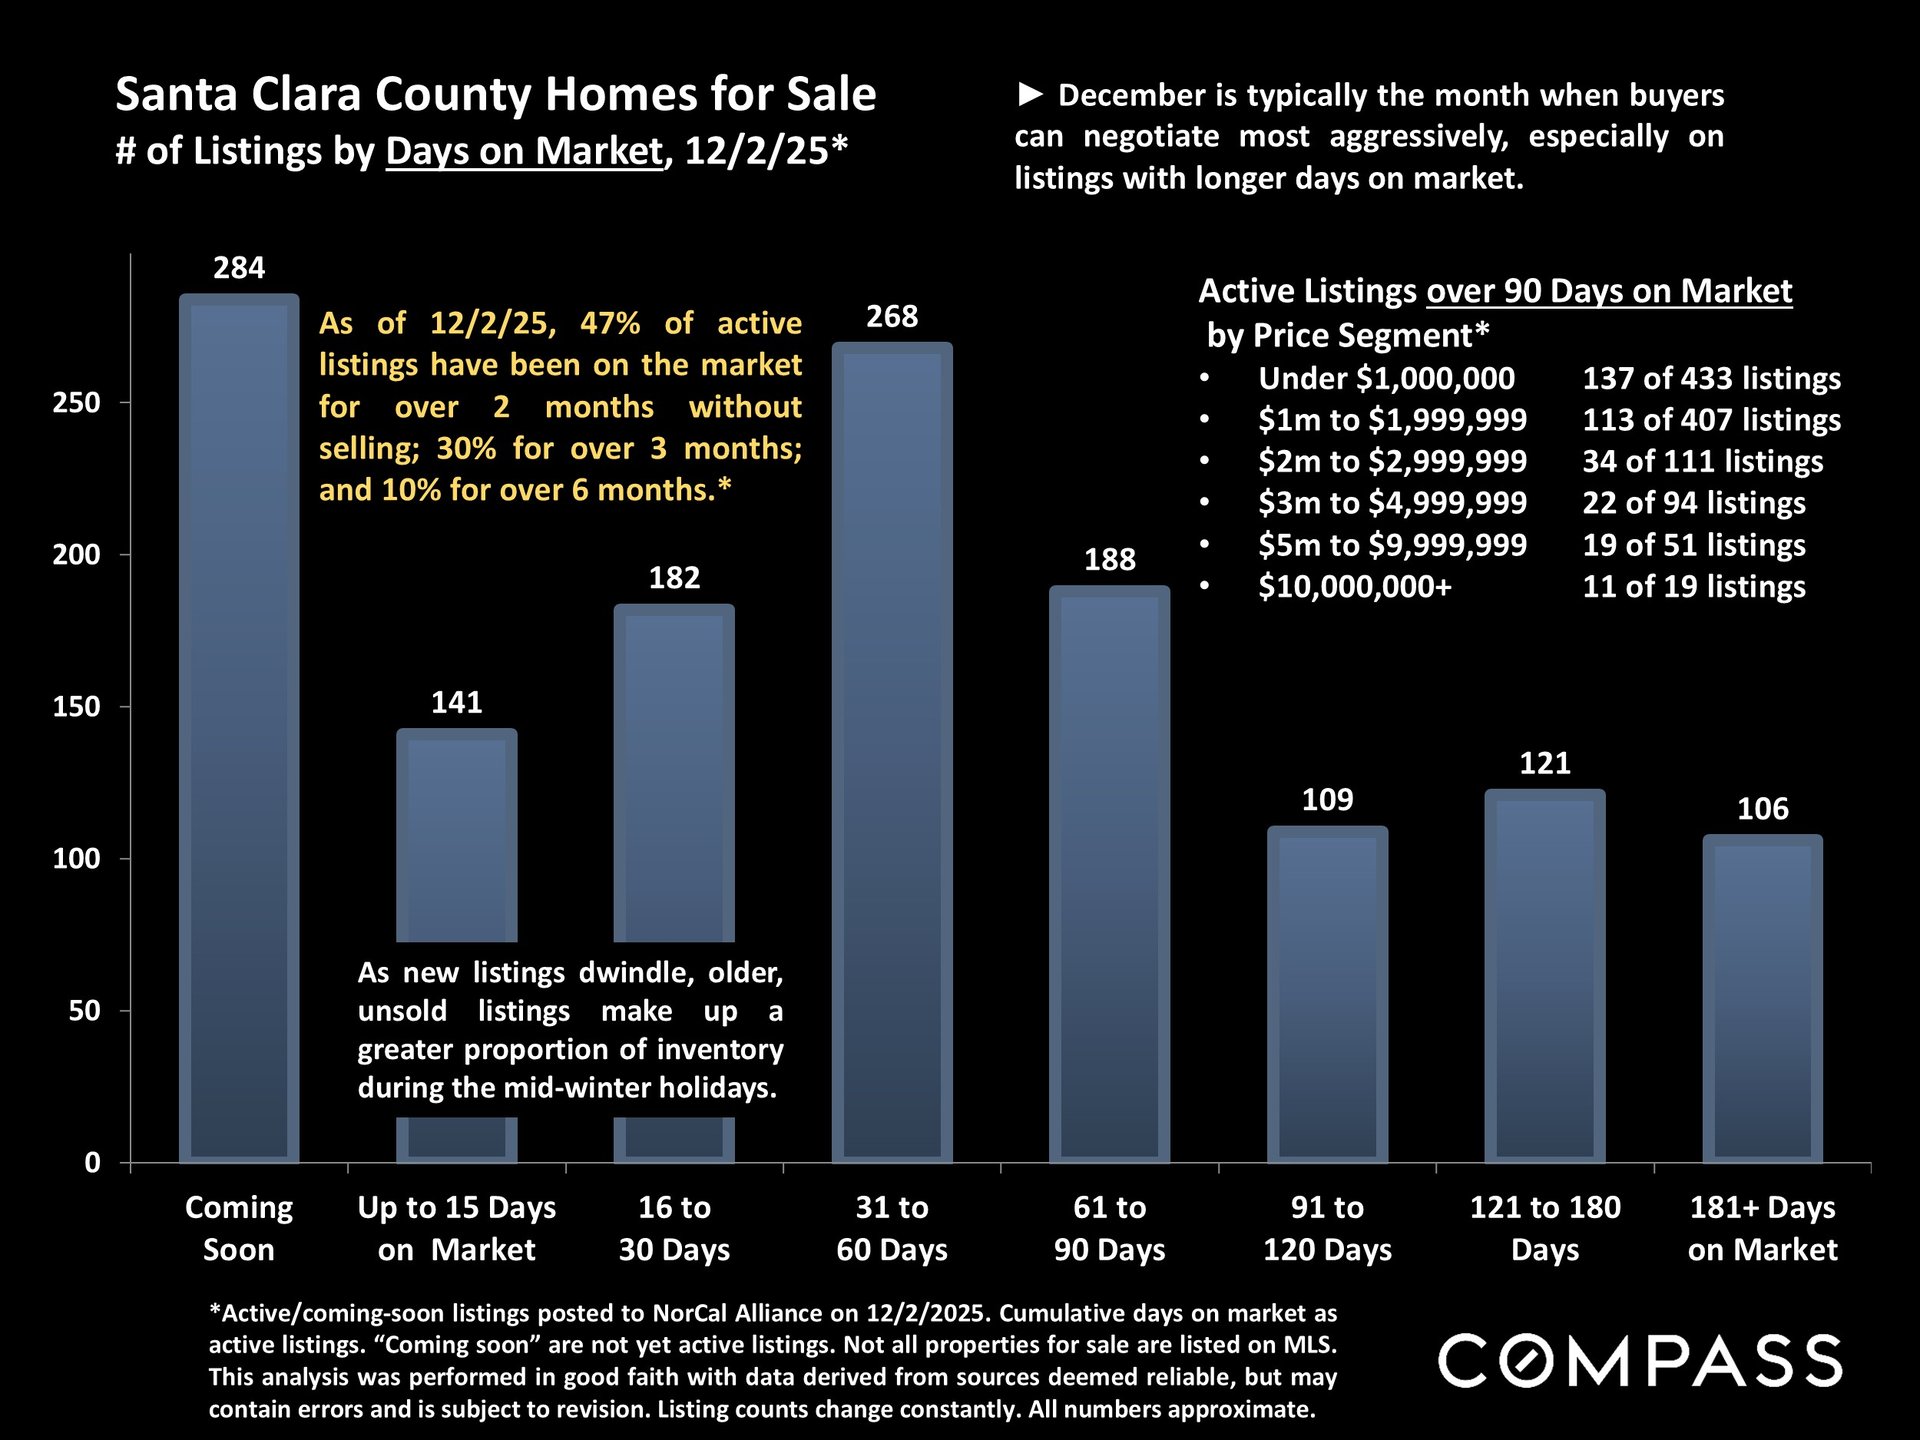
Although the inventory of new listings shrinks, December presents the period when motivated buyers can typically negotiate most aggressively, particularly on properties with extended days-on-market. As is virtually always the case, well-priced and prepared, and effectively marketed new listings can still sell quickly, often well above the asking price.

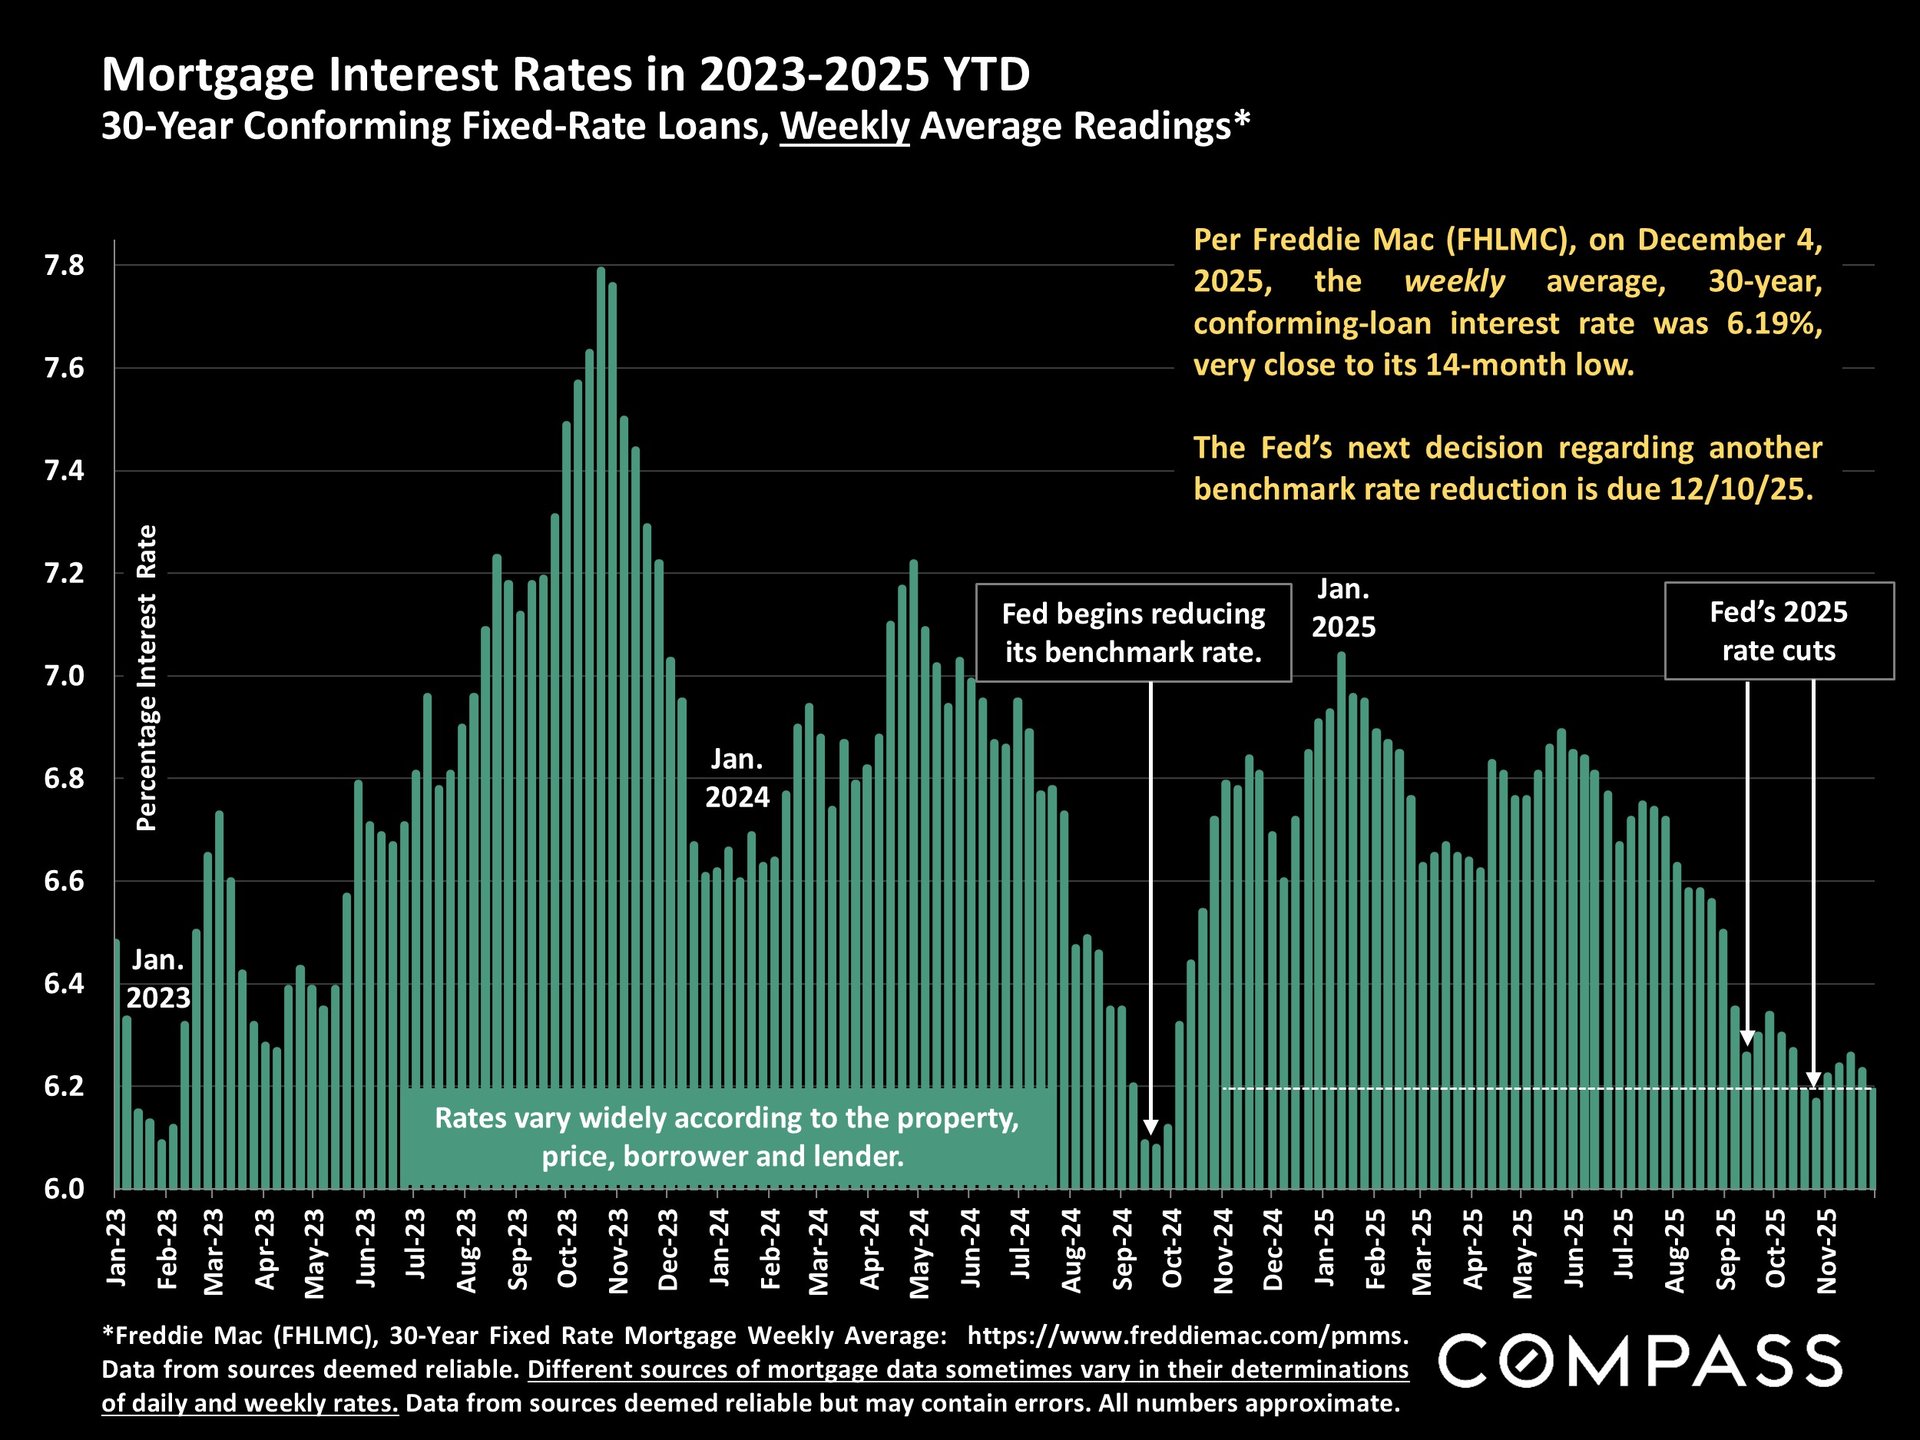
In the broader financial landscape, the first week of December saw the S&P 500 and Nasdaq largely recover from their substantial declines in November; and the 30-year mortgage rate was close to a 14-month low. While consumer confidence showed a modest rise from November, it remains very low by long-term standards. Attention is now focused on the Federal Reserve's upcoming decision regarding an end-of-year benchmark-rate reduction, and the subsequent inflation report due later in the month.


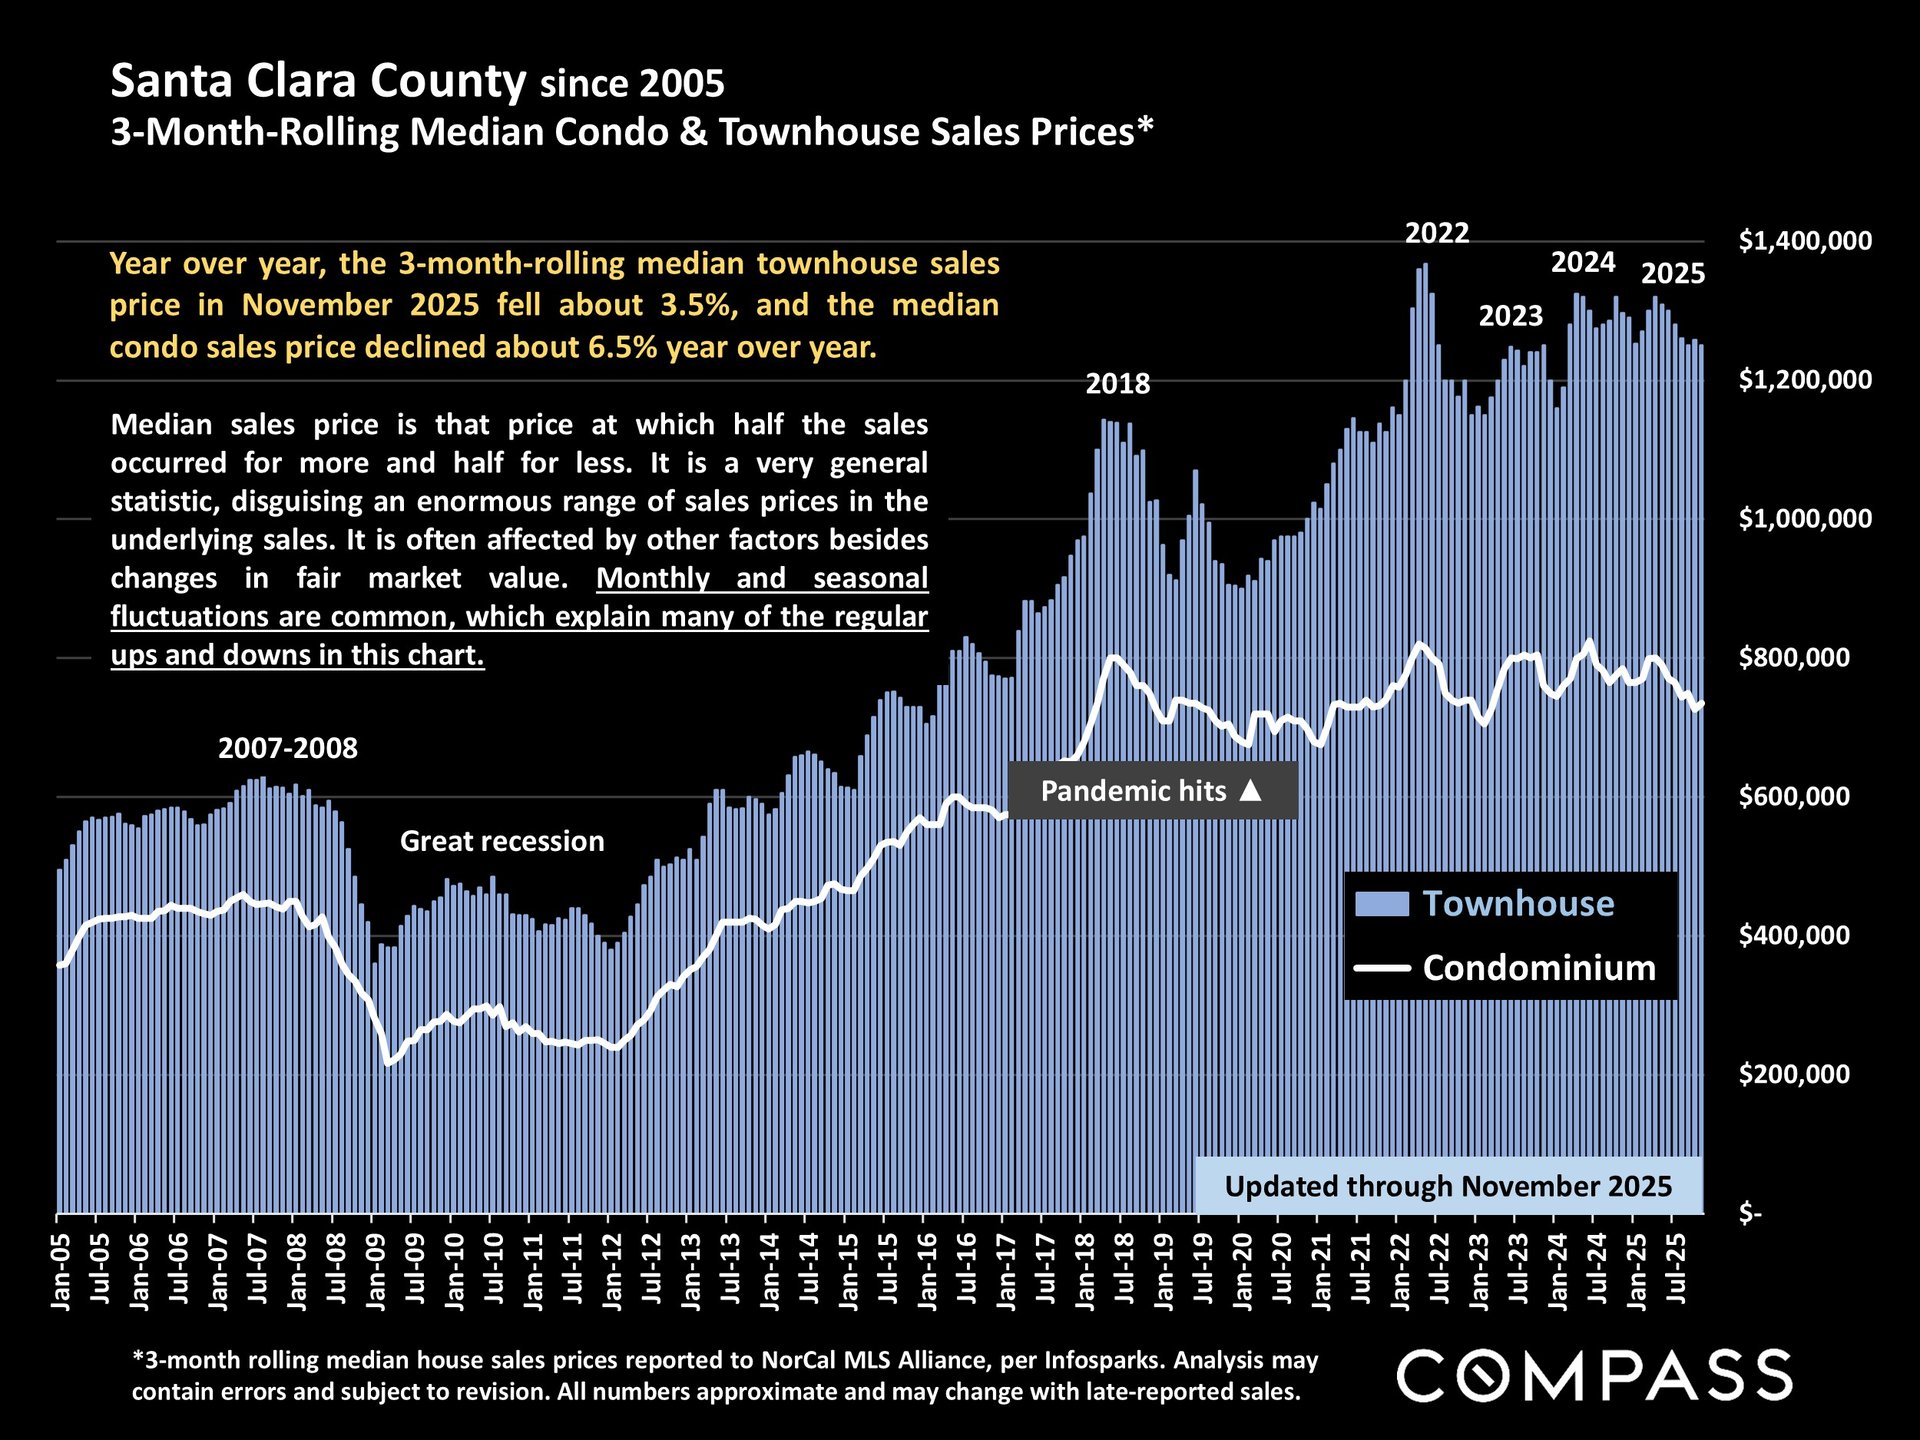
Santa Clara County's late-2025 housing data shows slight price softening and a typical seasonal drop in new listings.

Santa Clara County townhouse and condominium price chart, updated through November 2025, with historical trends and year-over-year declines.

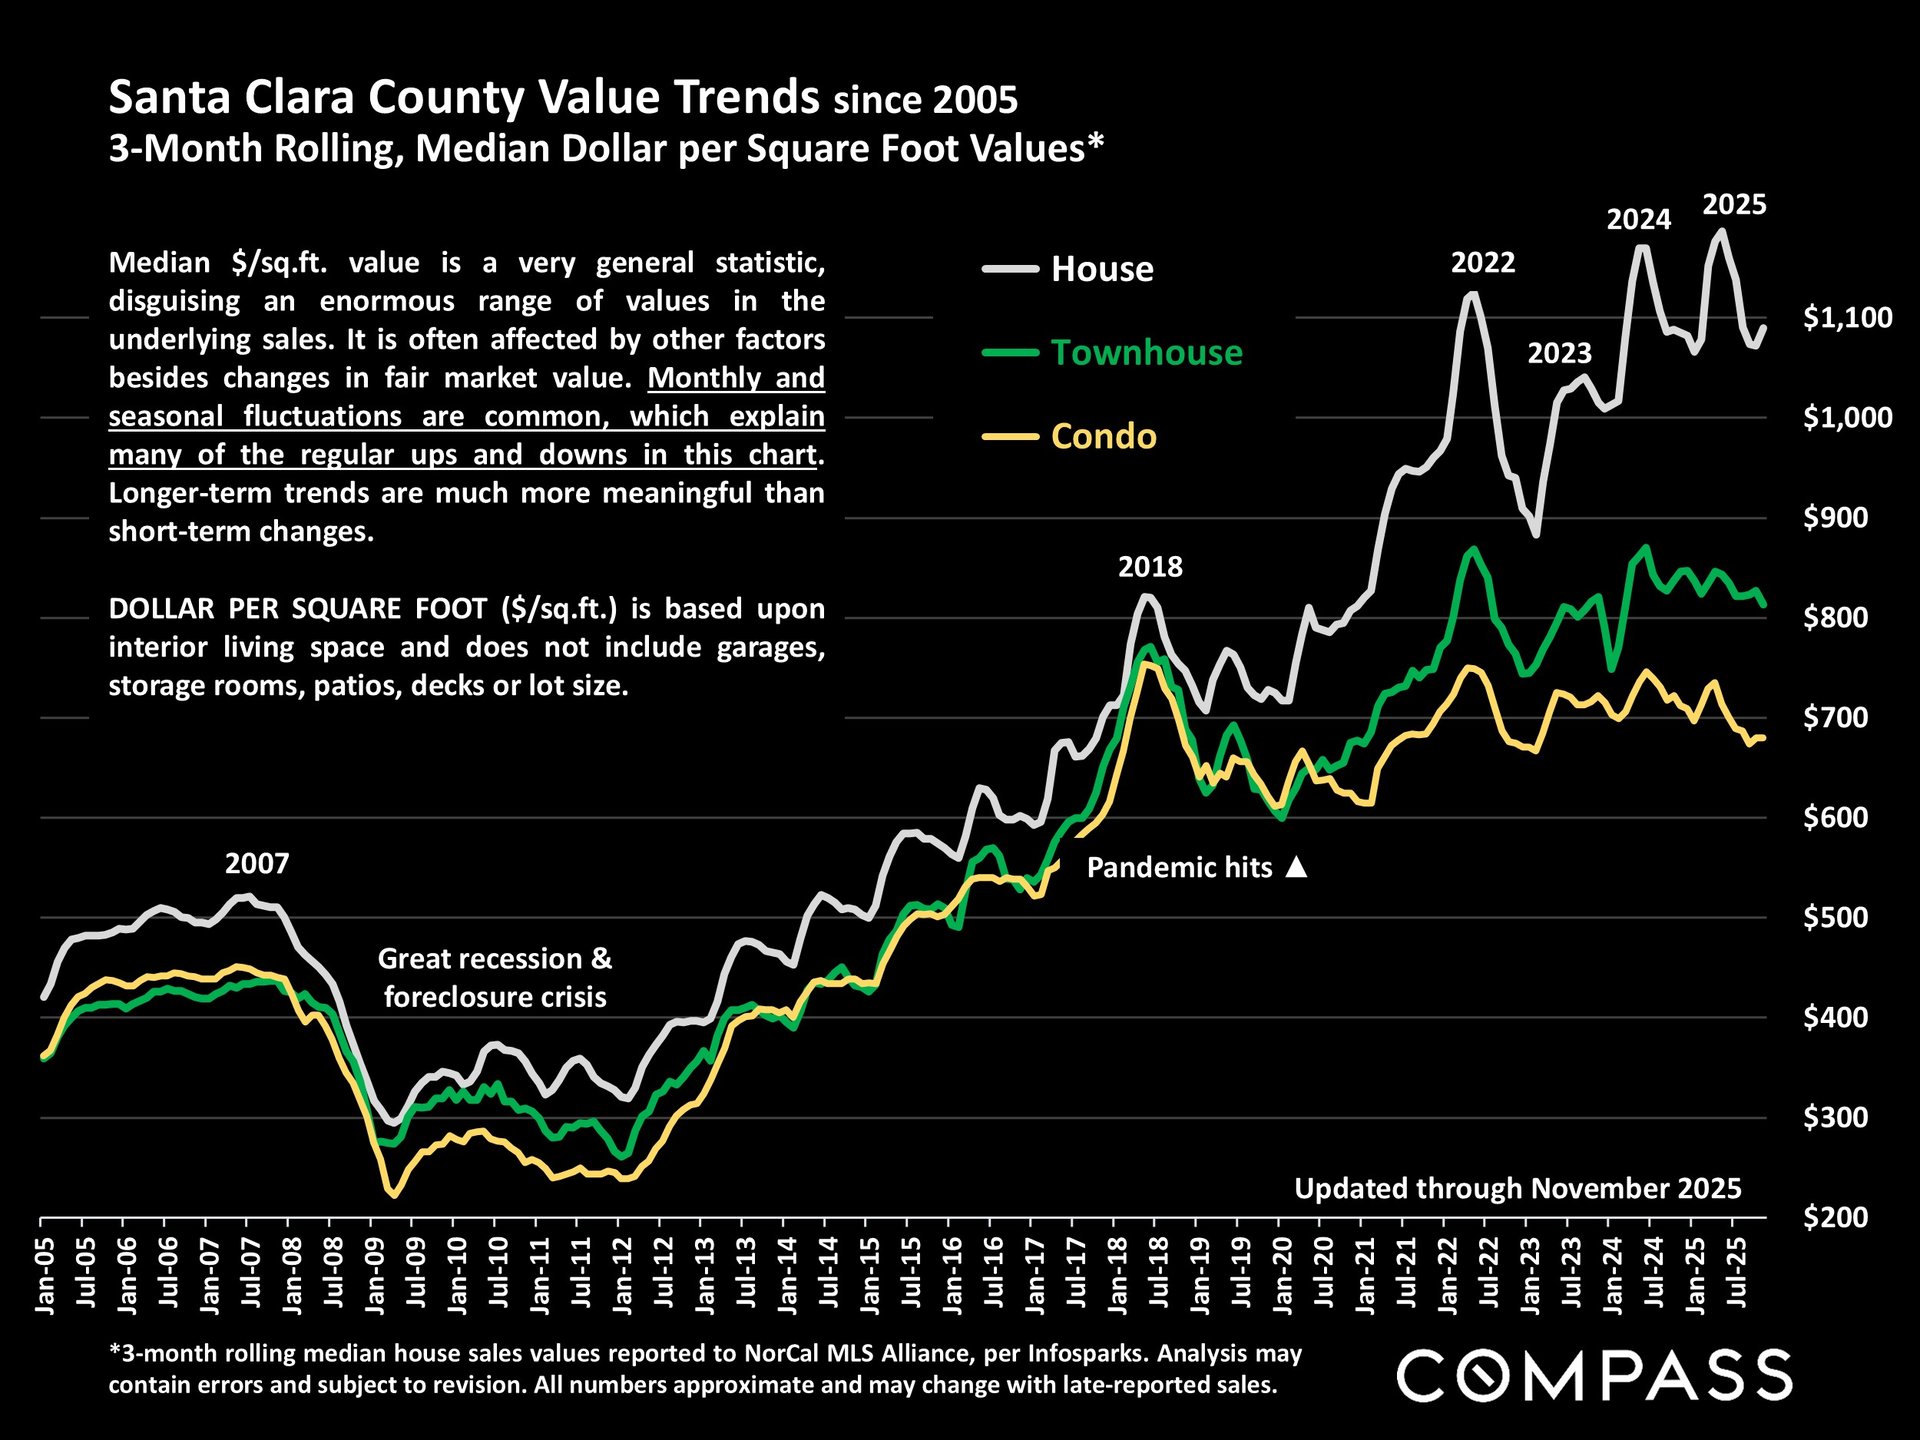
Santa Clara County home-value chart, with house, townhouse, and condo trends through November 2025.

Chart of Santa Clara County monthly new listings from 2021 to November 2025, highlighting seasonal December lows.


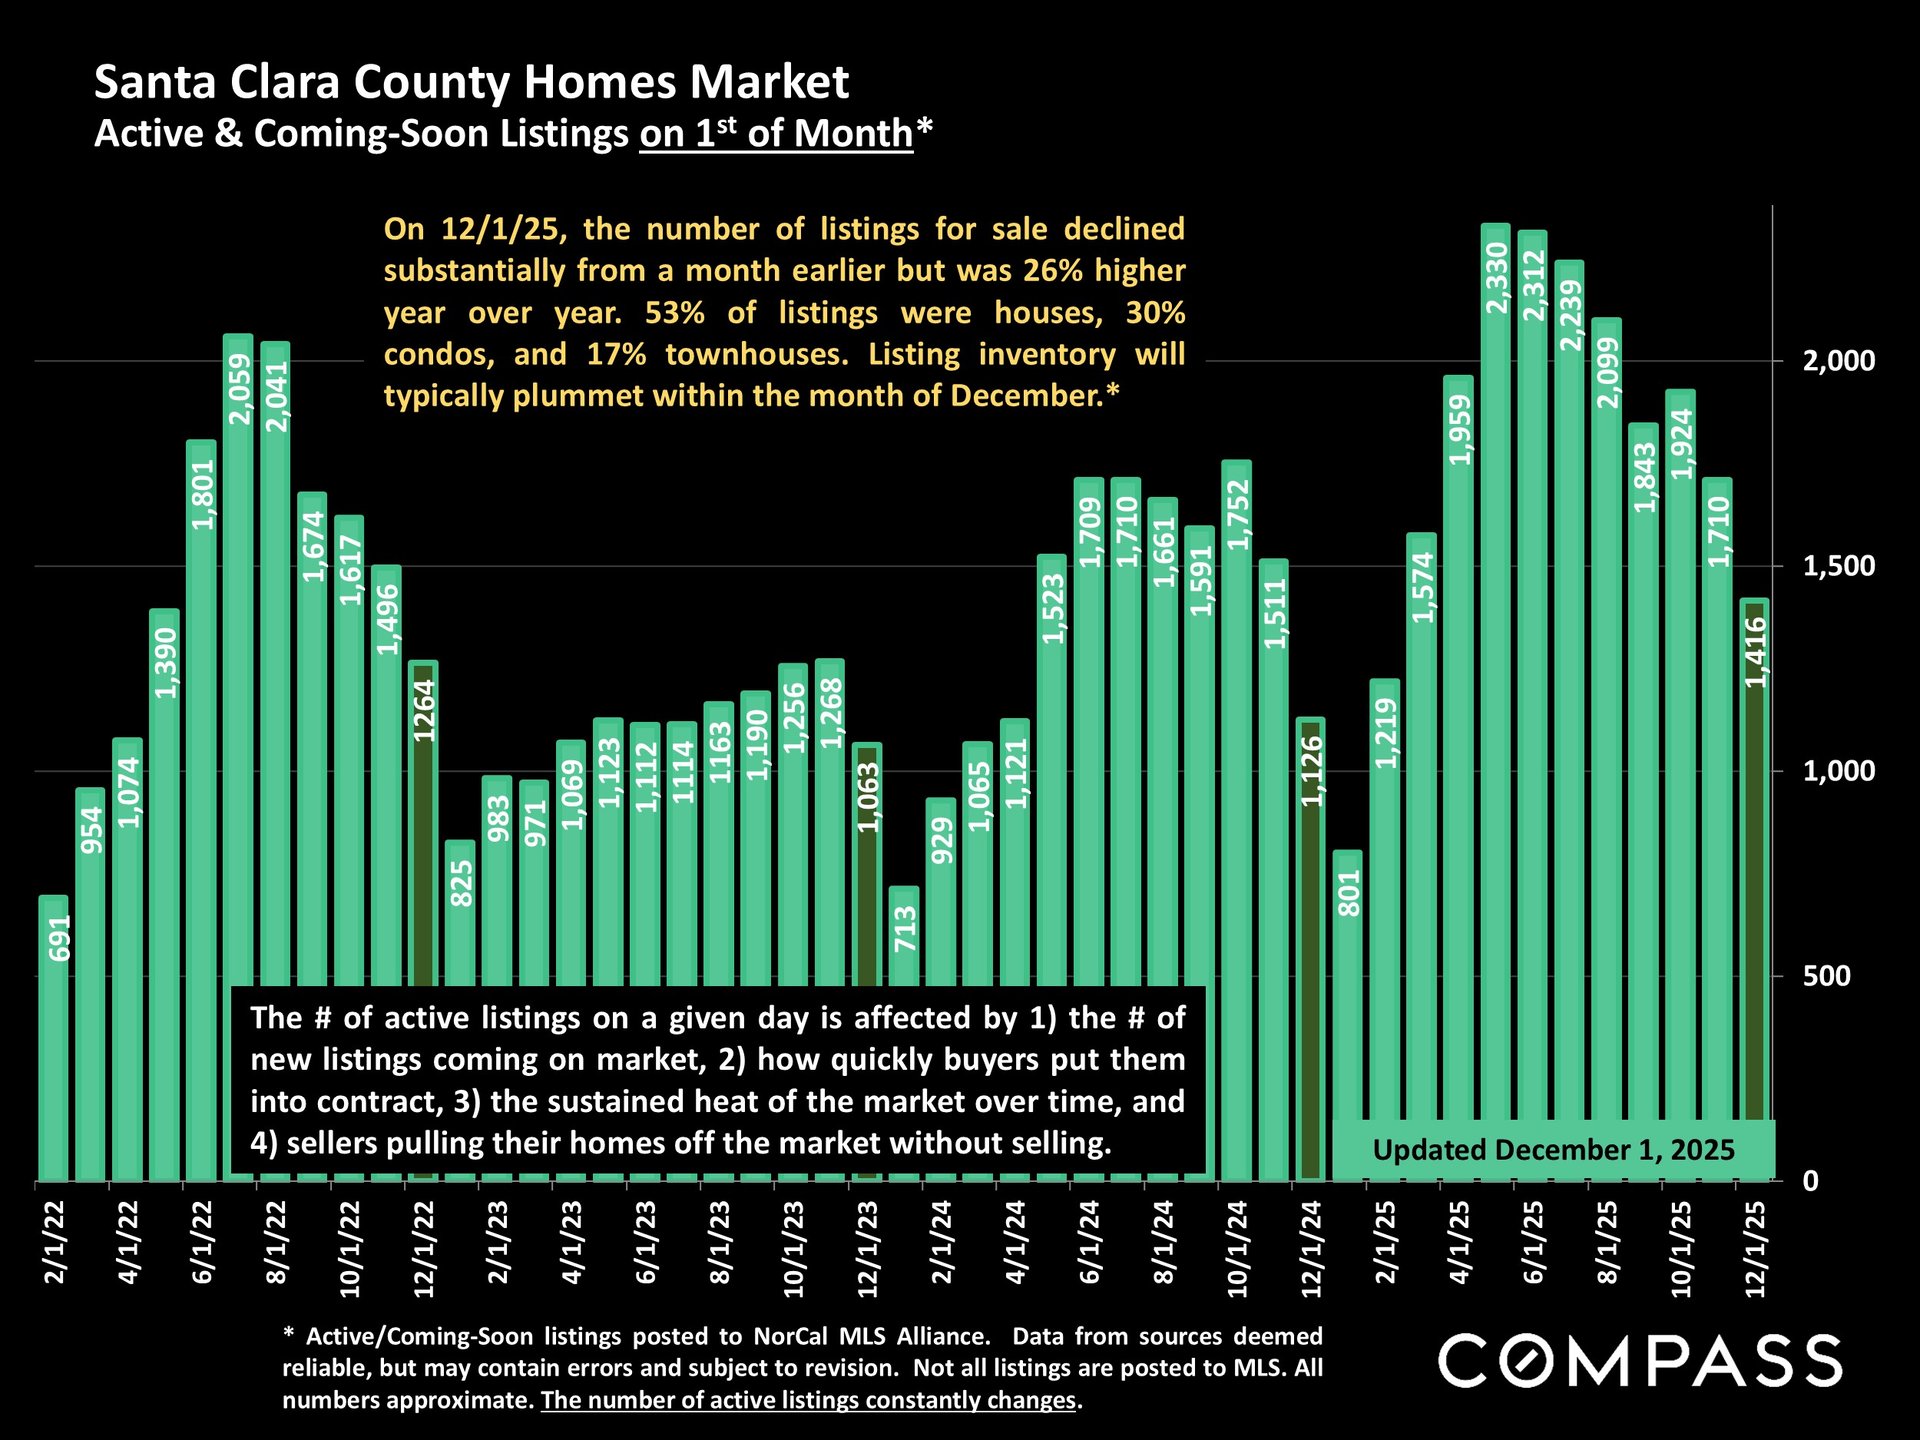
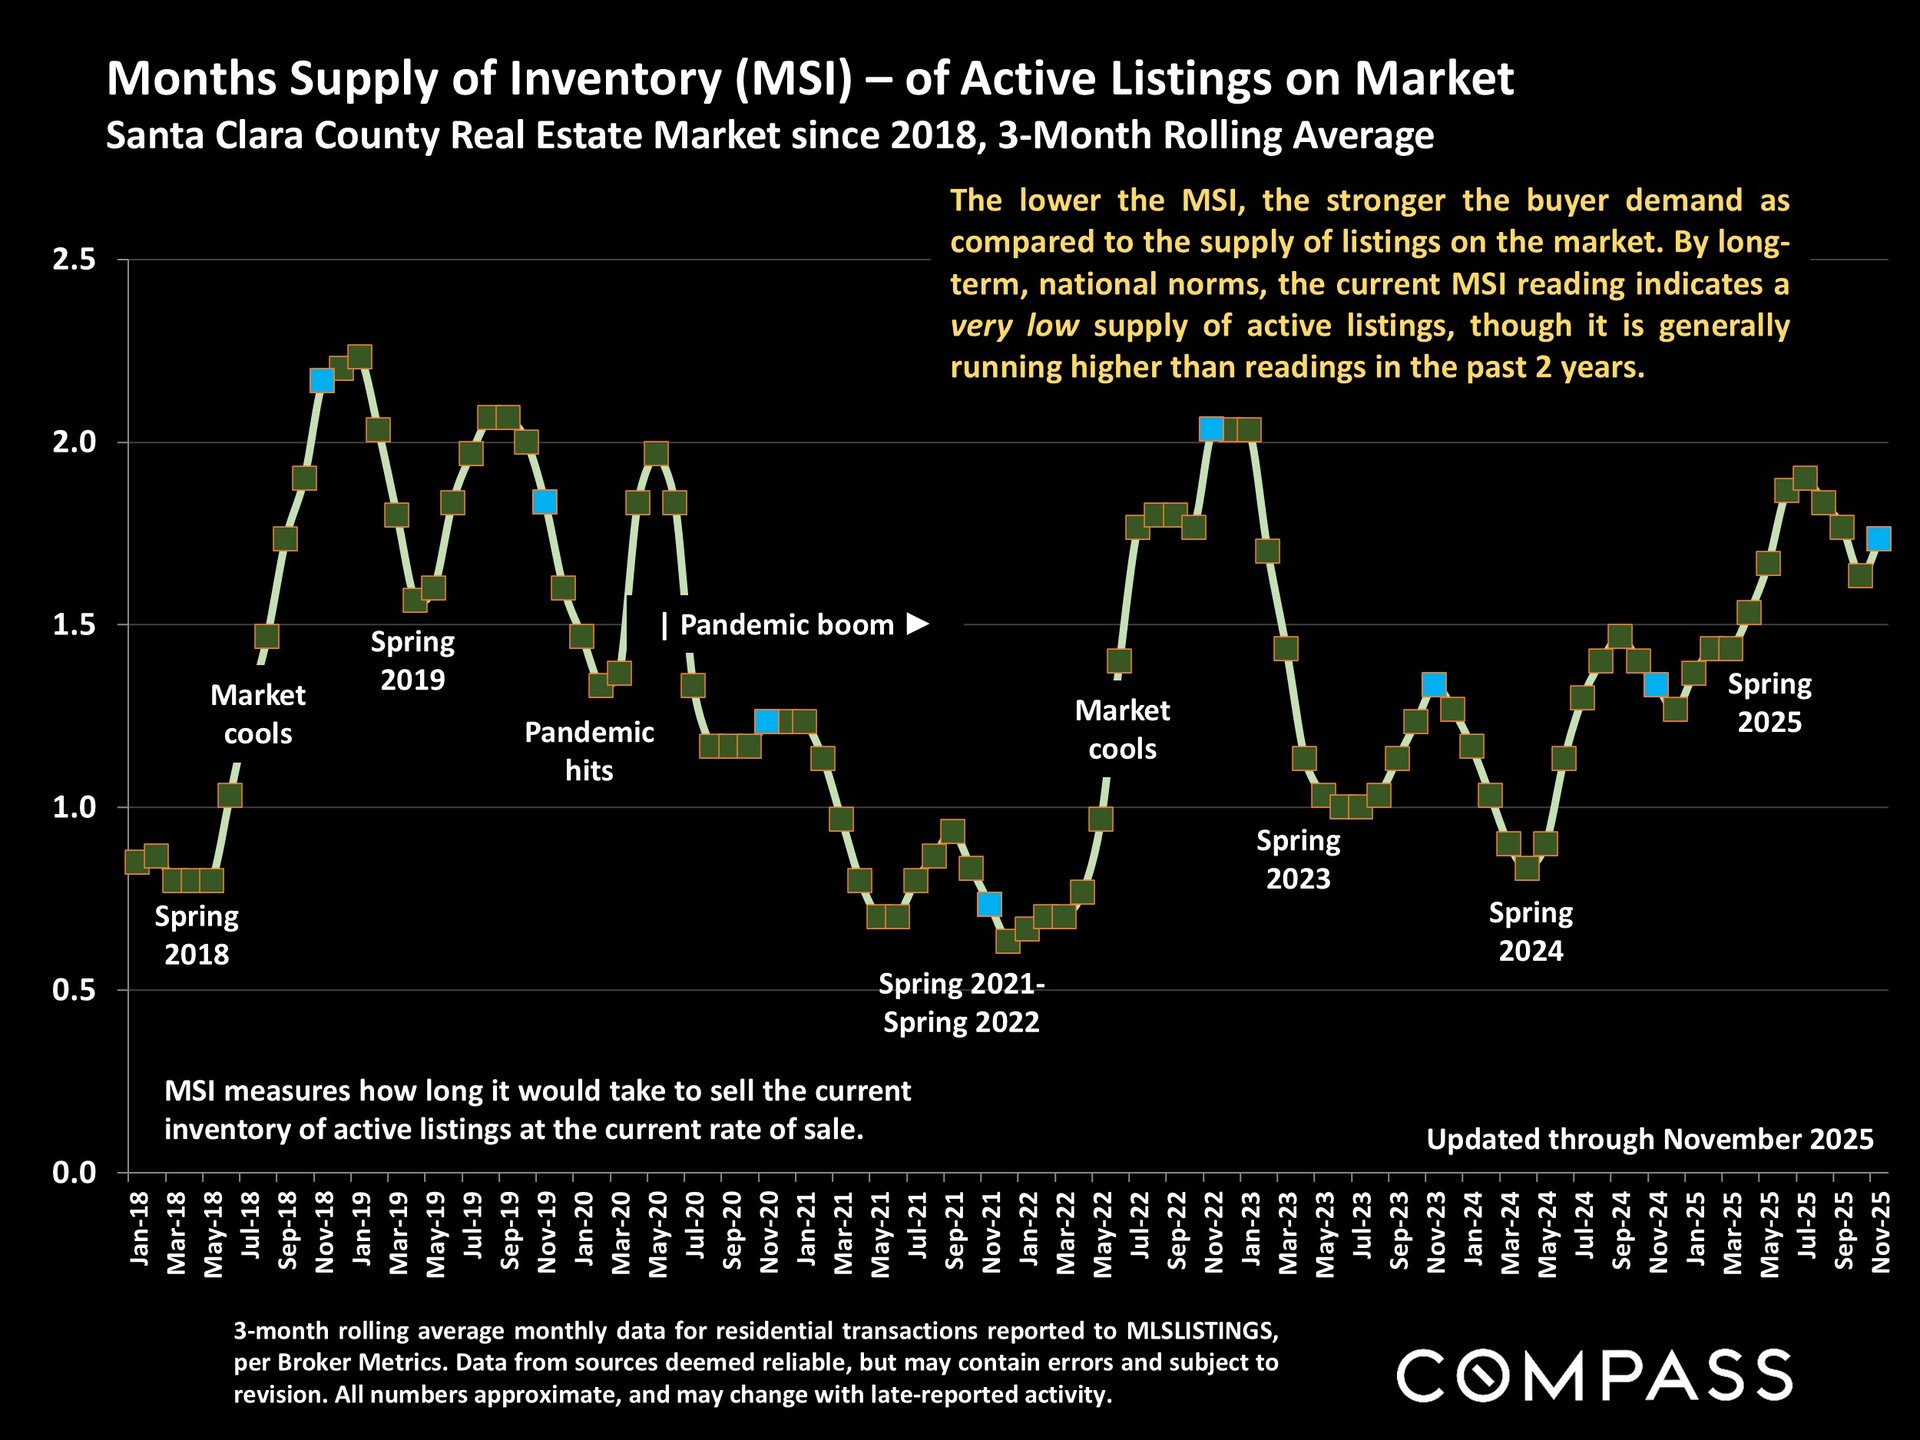
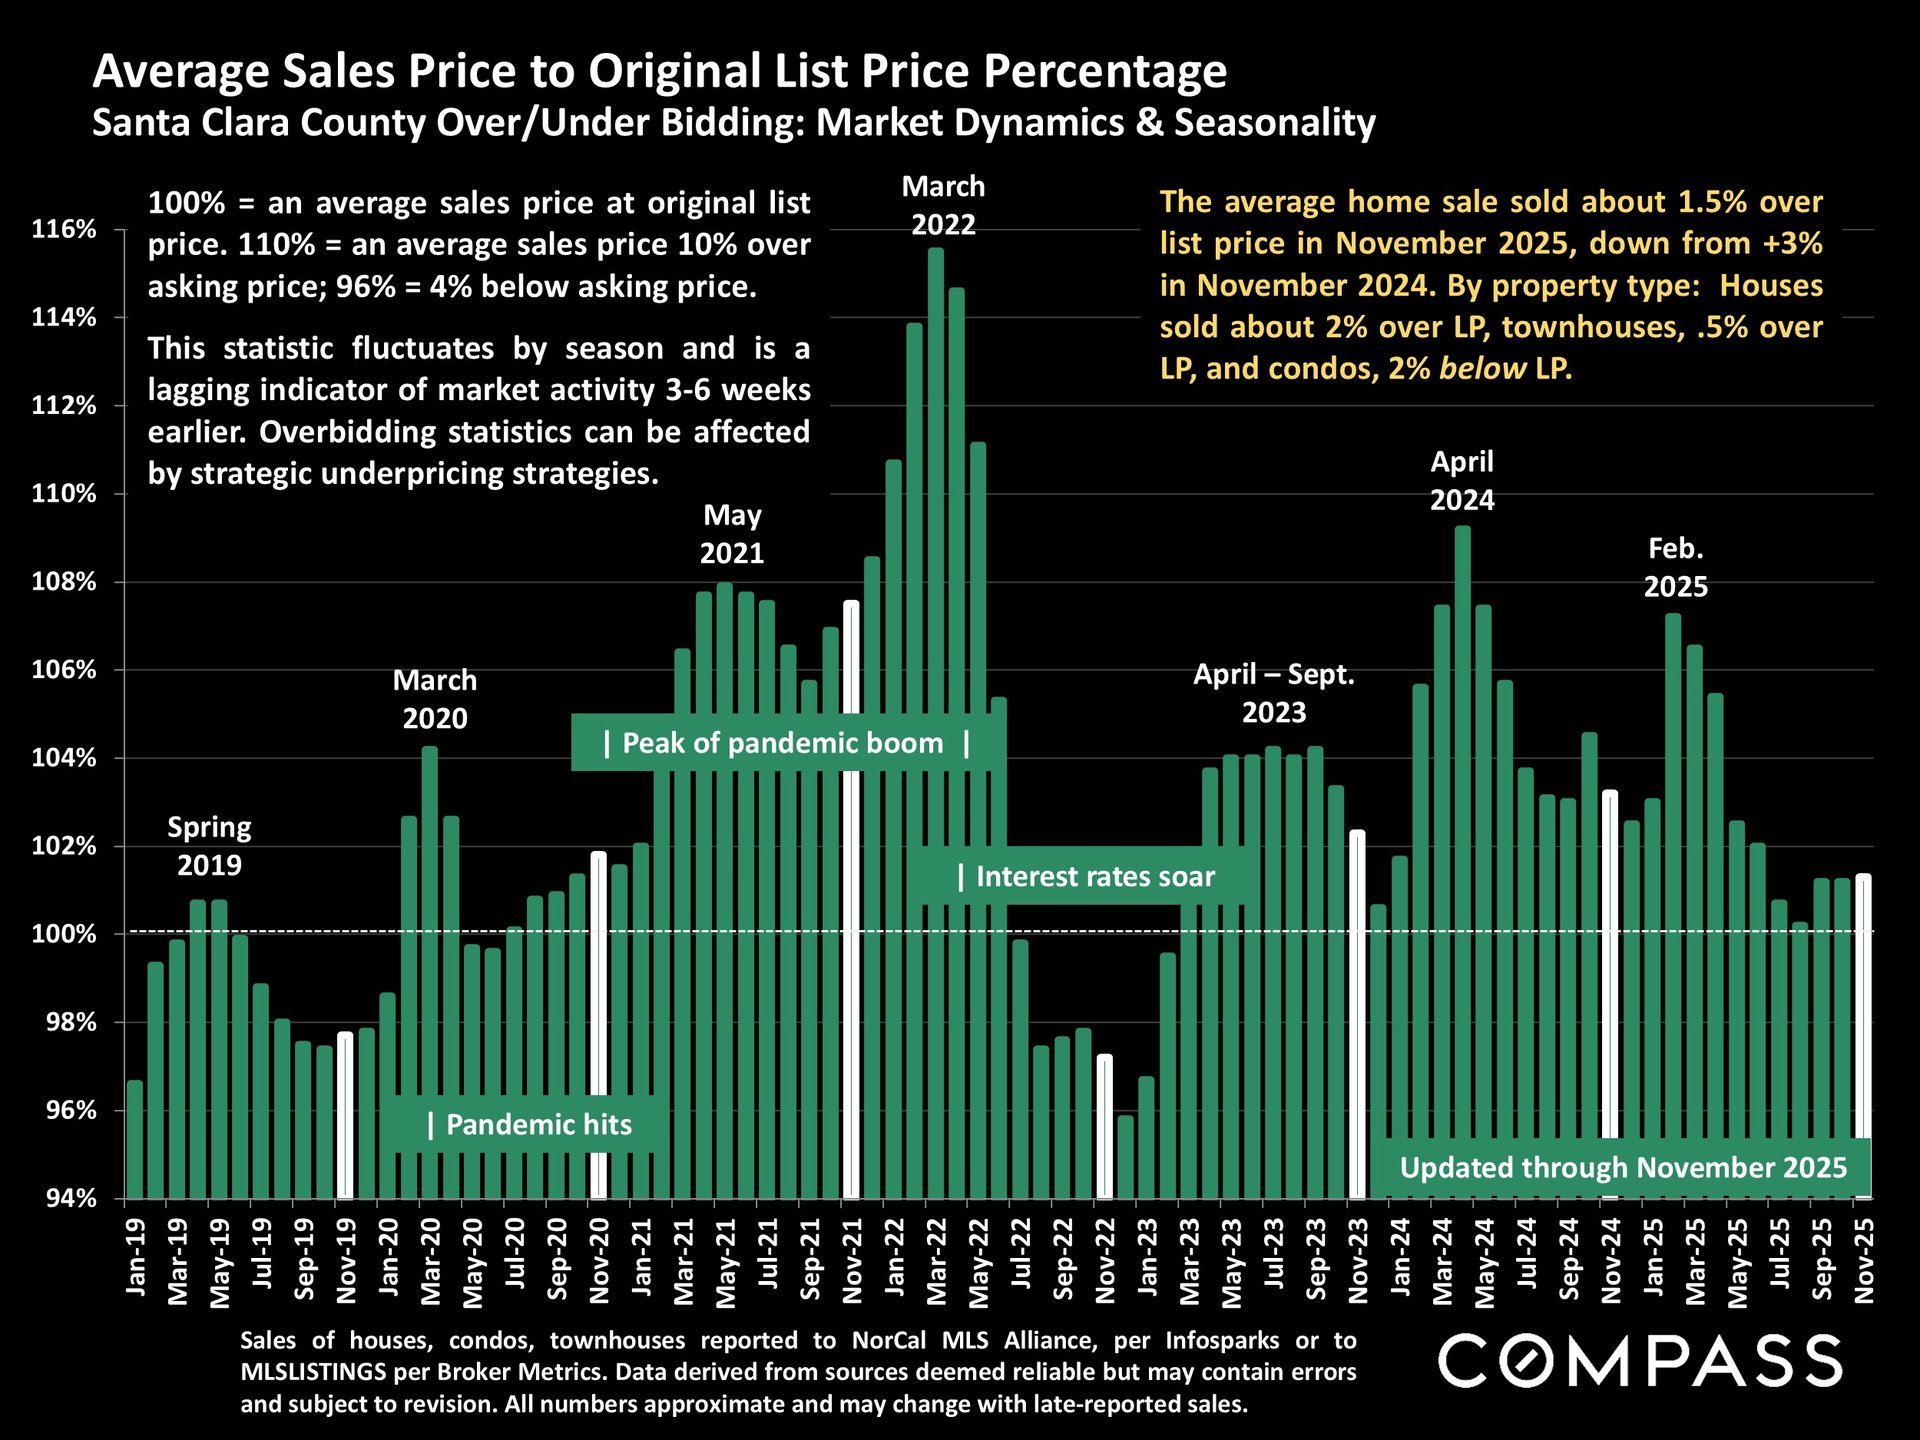
Inventory is up year over year in the housing market, with slower sales, many long-sitting listings, low months of supply, and cooling overbidding as buyer demand softens.

Santa Clara County active and coming-soon listings chart, with monthly counts through December 2025.

Santa Clara County home listings by days on market, with counts, negotiation notes, and price-segment statistics.

Chart of Santa Clara County months supply of active listings, January 2018 to November 2025.

Santa Clara County home sale-to-list price chart, with monthly data from 2019 to November 2025.


Here are some dates showing the current economic trends. 

Chart of 30-year mortgage rates from 2023–2025, highlighting the December 2025 average of 6.19%.

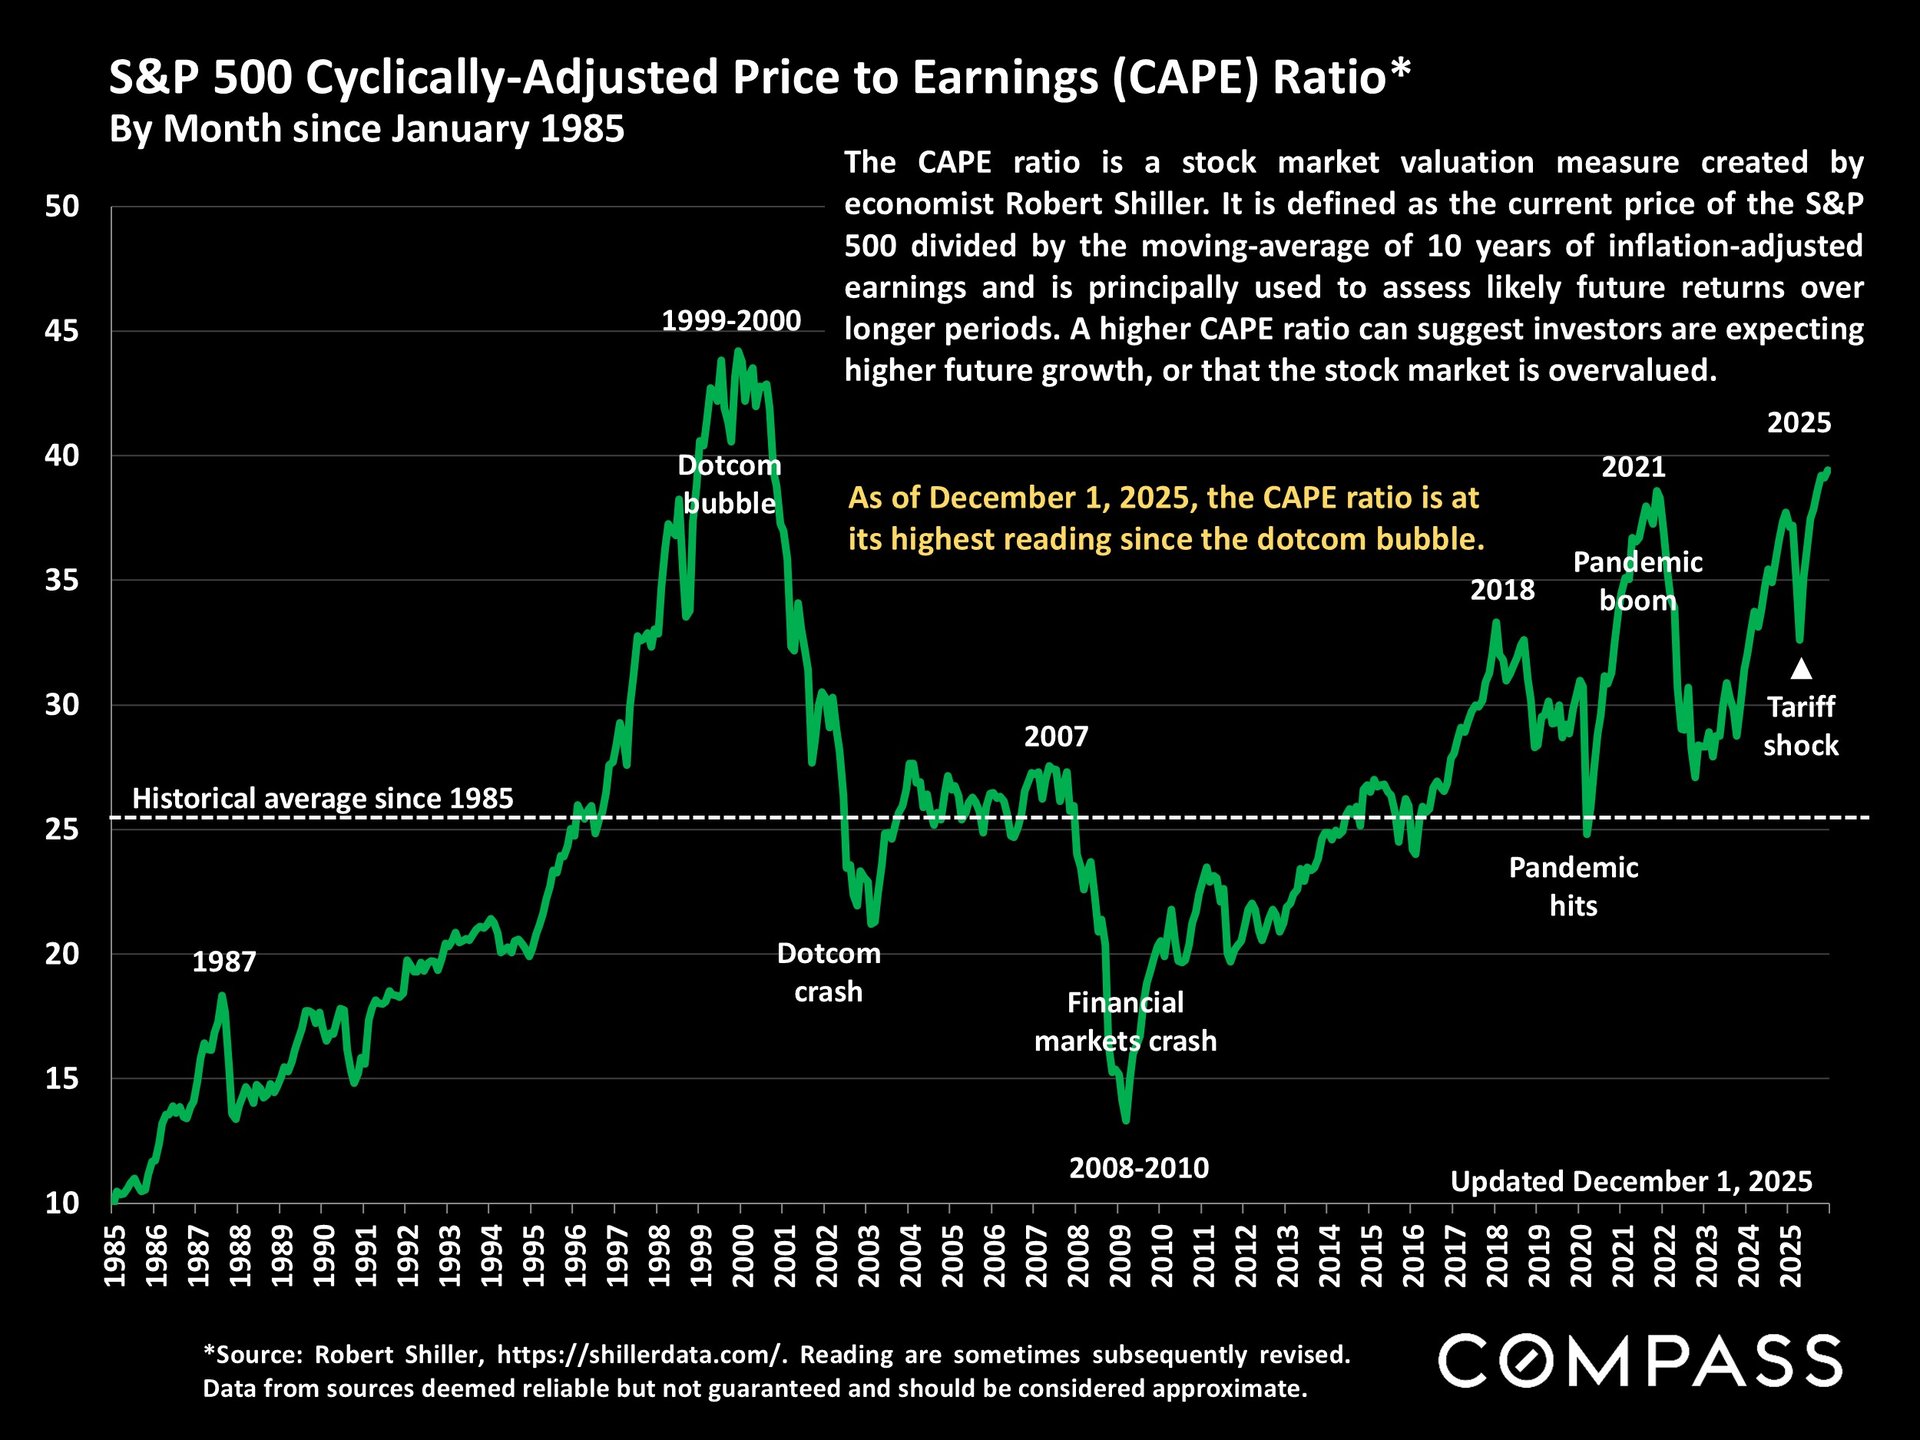
Chart of the S&P 500 CAPE ratio from 1985 to 2025, with a historical-average line and market-event annotations.

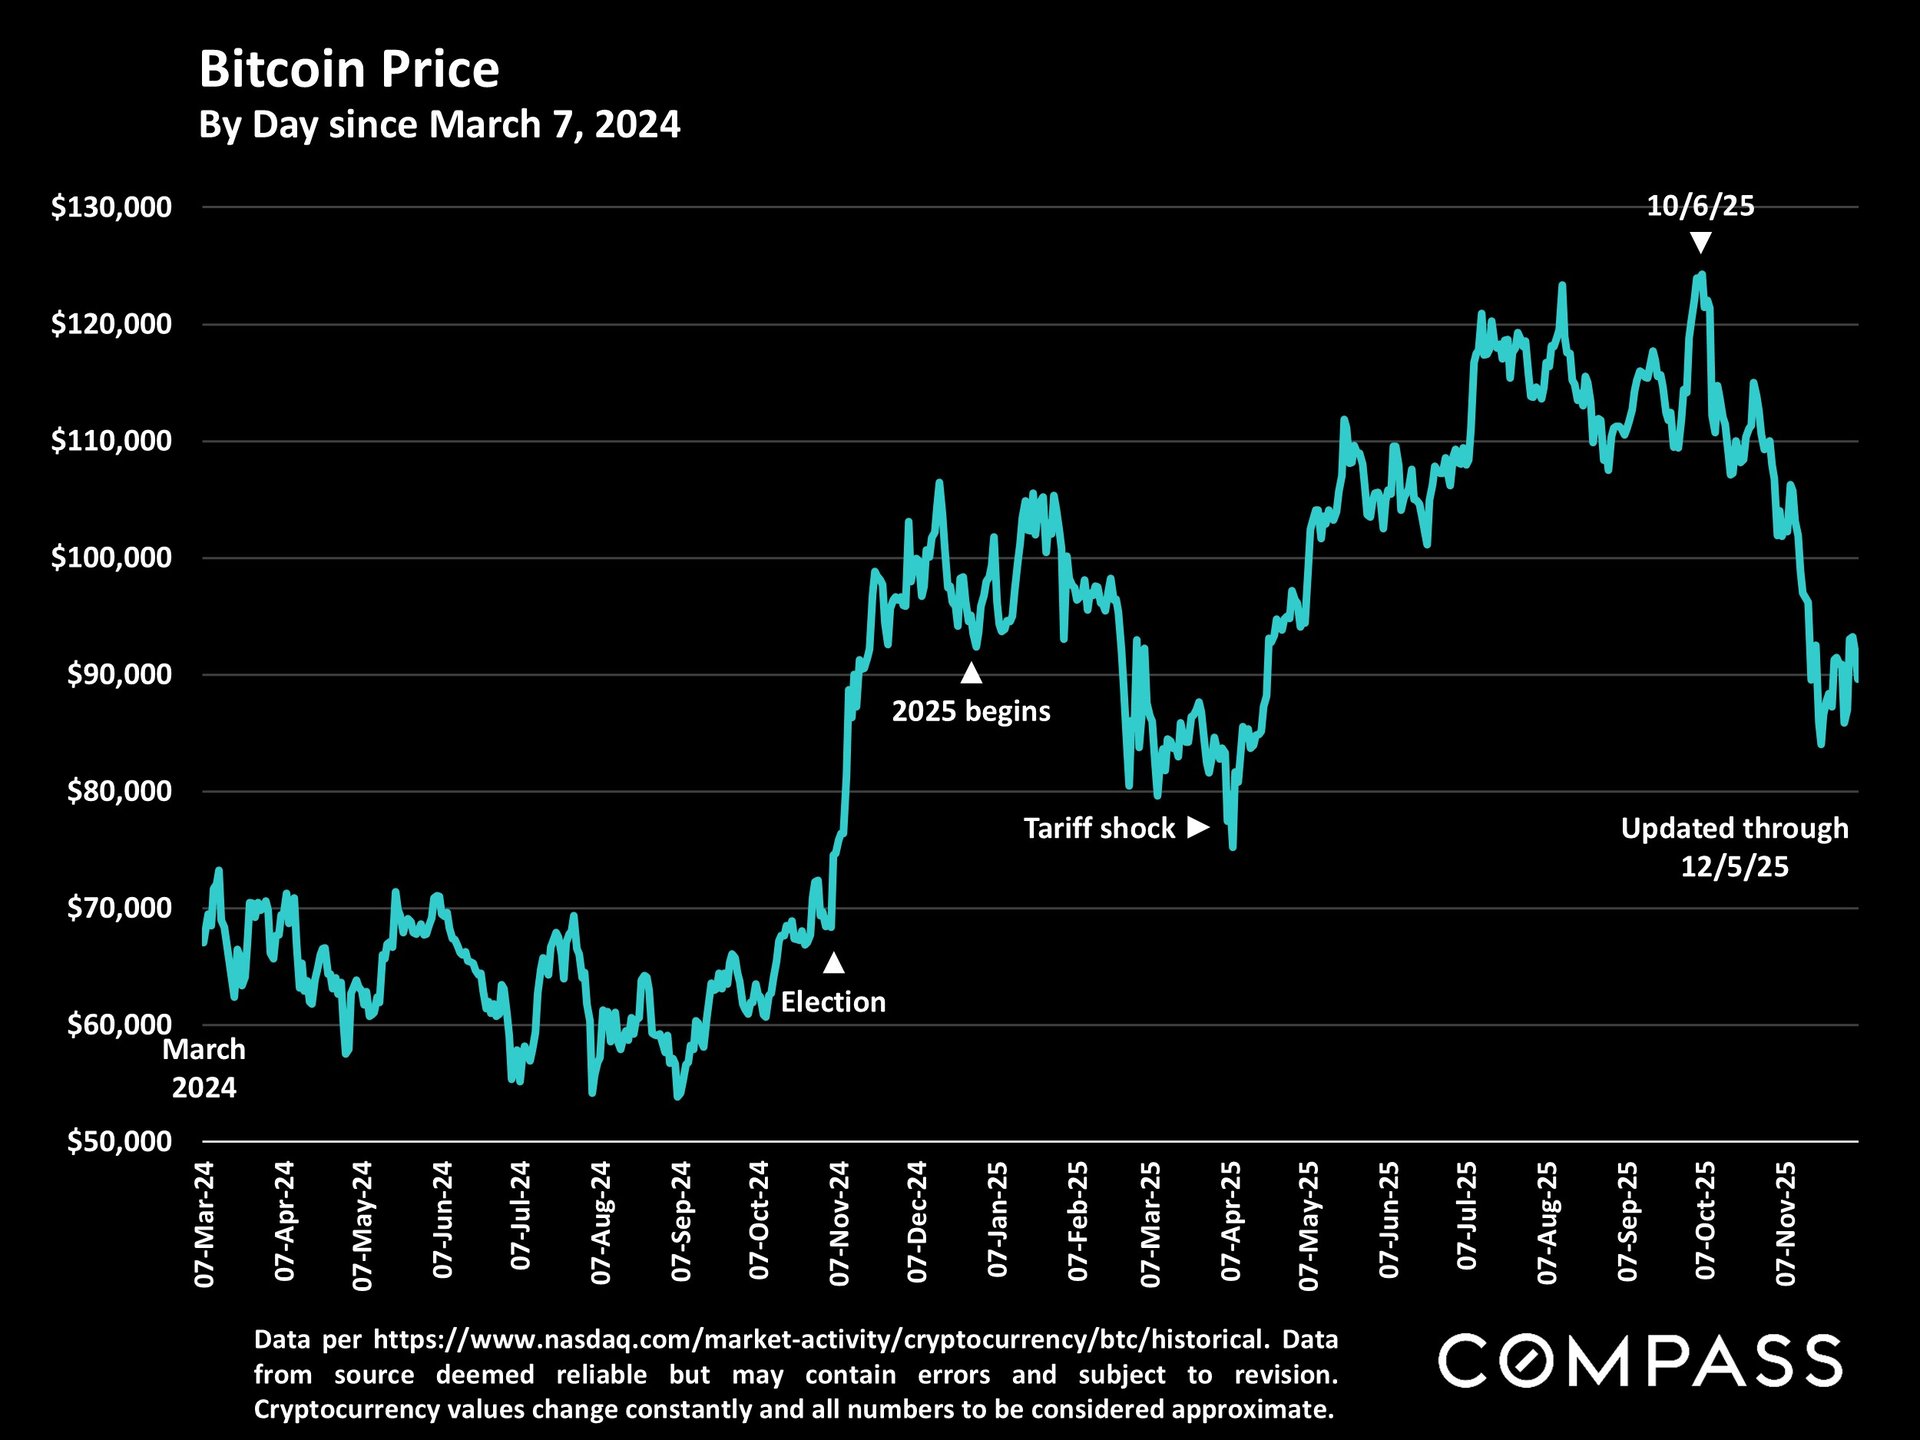
Bitcoin price chart from March 2024 to December 2025, with a turquoise line and annotated market events.


Questions? Reach out to us at (650) 988-5114.


Work With Us

Partner with our dynamic team to unlock the full potential of your real estate endeavors in Silicon Valley. With our tailored approach and in-depth market knowledge, we'll ensure a seamless and extraordinary client experience.

Follow Us